
 バータイプ
バータイプサブチャート
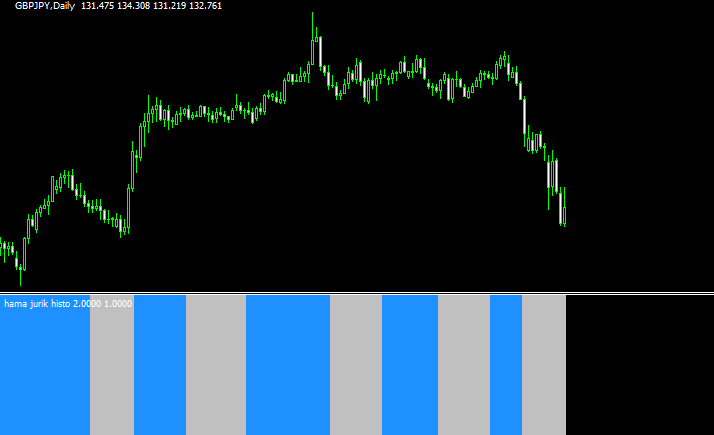
バータイプ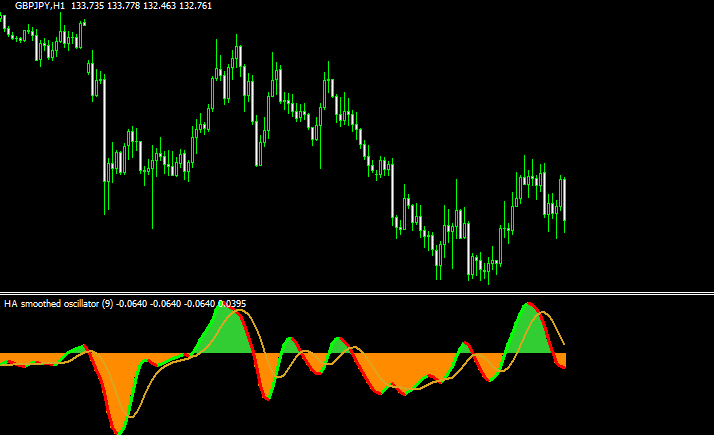 オシレーター
平均足スムーズドをオシレーター化した「heiken ashi smoothed oscillator」
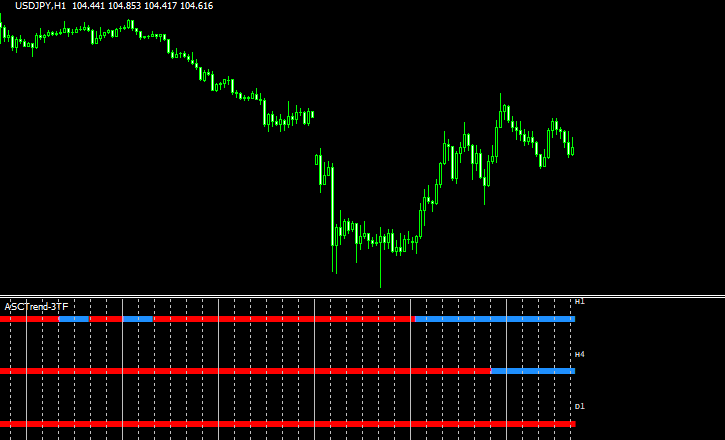 バータイプ
バータイプ3つの時間足でASCTrendの方向を示す「ASCTrend-Matrix 3TF」
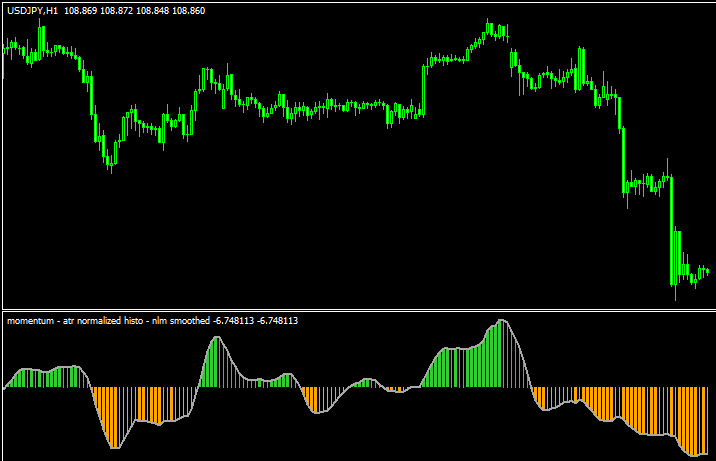 オシレーター
モメンタムをベースとした「momentum – atr normalized histo – nlm smoothed 」
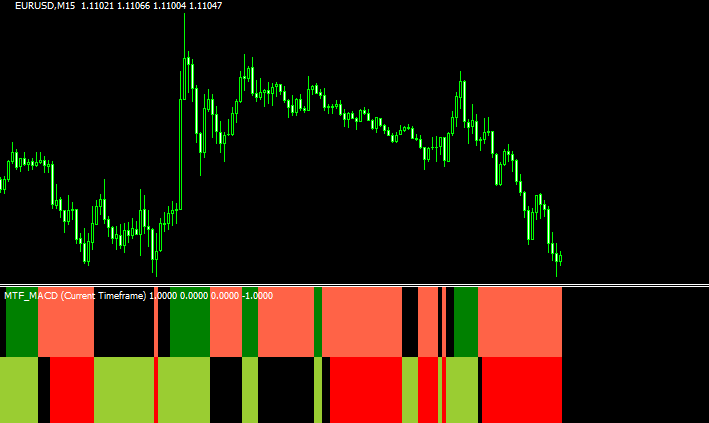 バータイプ
バータイプMACDの状況をバーで示す「MTF MACD Bars」
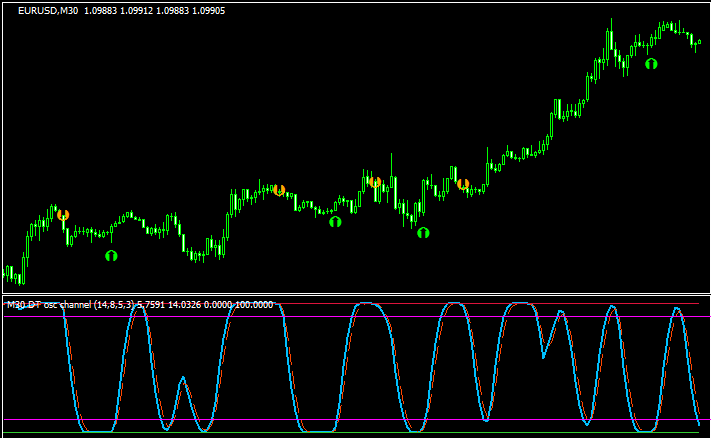 オシレーター
色々な指標を組み合わせたオシレーター「DTosc_Channel_arrows nmc」
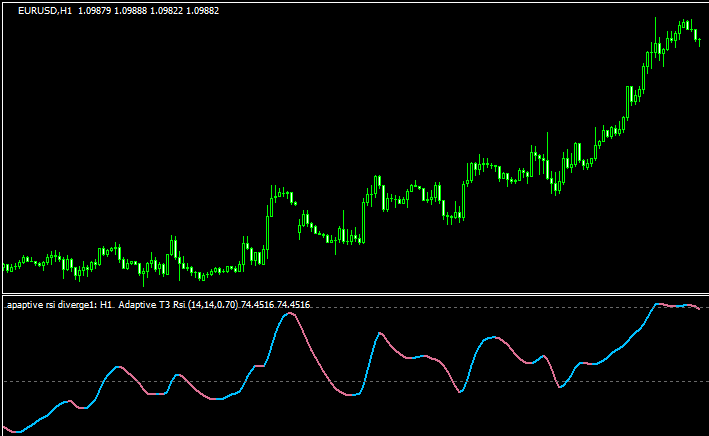 オシレーター
マルチタイムに対応し、ダイバージェンスも自動で認識するT3 RSI「Adaptive T3 Rsi 1.01 nrp divergence nmc」
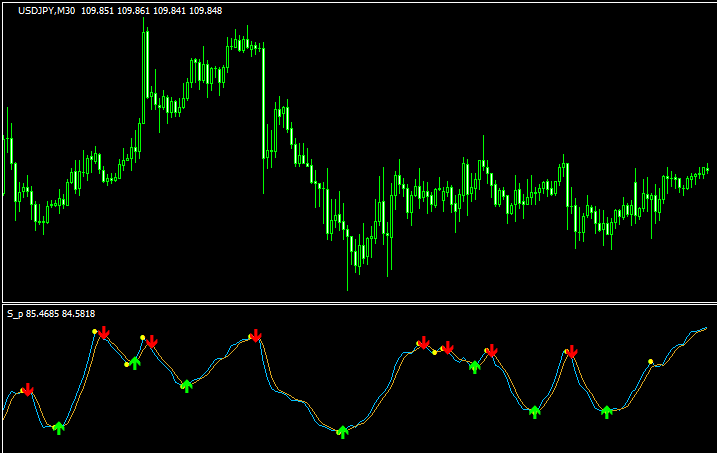 オシレーター
ストキャスのクロスでサインの出る「stochastic-signals-mtf」
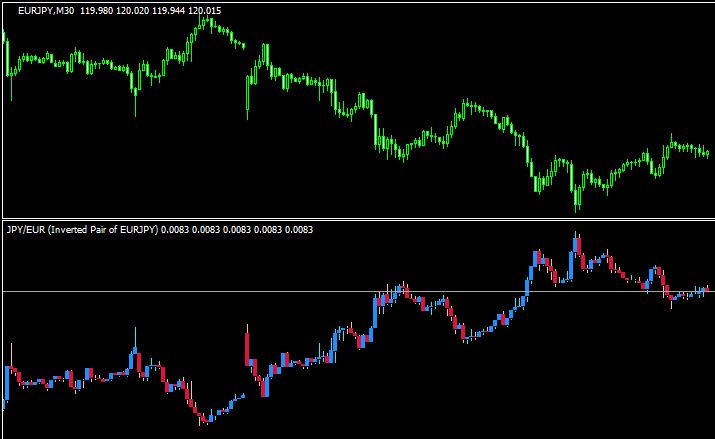 ローソク足
ローソク足サブウィンドウにチャートを上下反転して表示できる「Inverted_Pair」
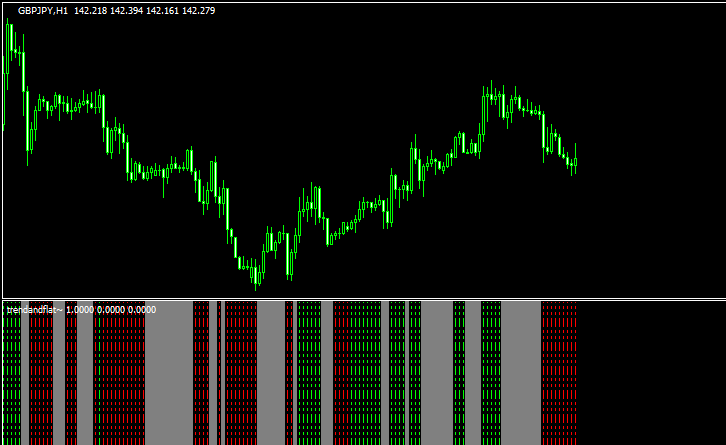 バータイプ
バータイプトレンドかレンジかが一目で分かる「trendandflat~」
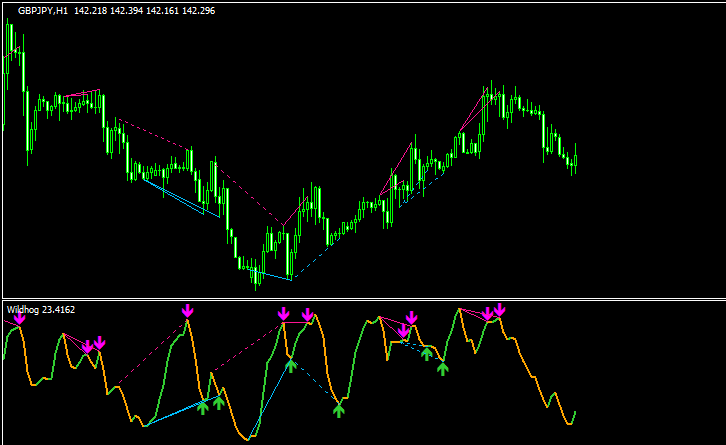 オシレーター
ダイバージェンスやヒドゥンダイバージェンスを認識する「Wildhog Indicator」
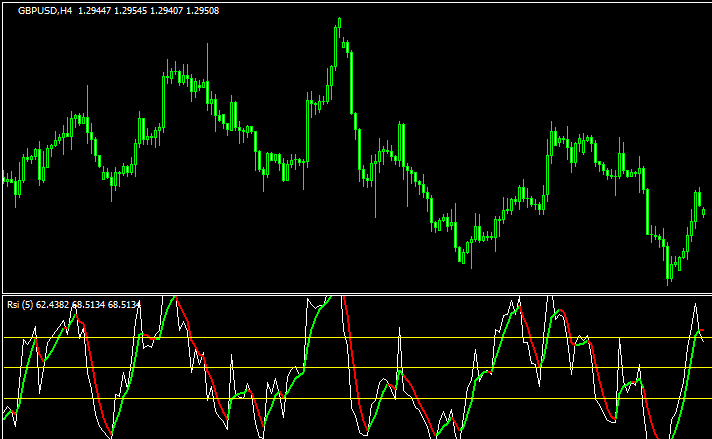 オシレーター
RSIとRSI移動平均線を表示させる「RSI & average & alerts & lines」
 オシレーター
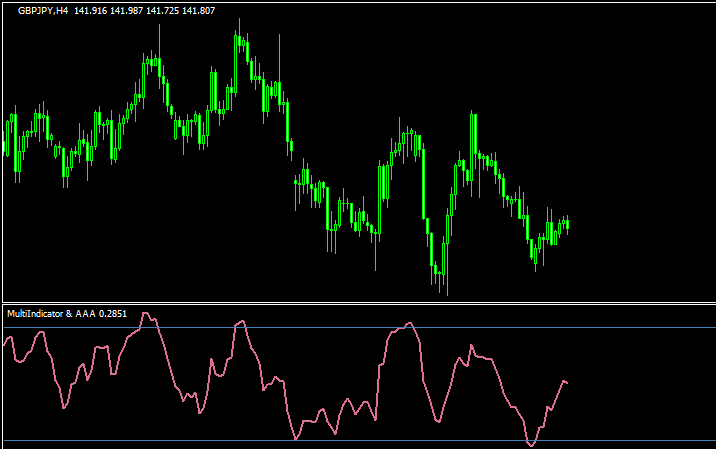
【最強?】6のインジを組み合わせたオシレーター「6indicator-combined」
 オシレーター
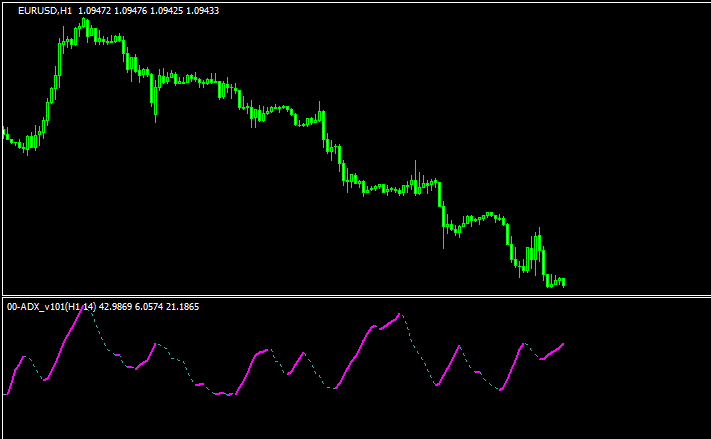
マルチタイムでADXを表示できる「00-ADX_v101」
 オシレーター
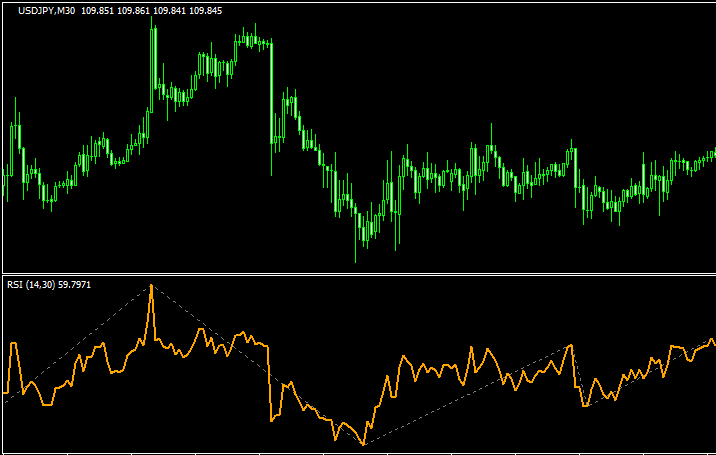
RSIでジグザグのような相場の波を描く「RSI 4 high low zigzag」
 オシレーター
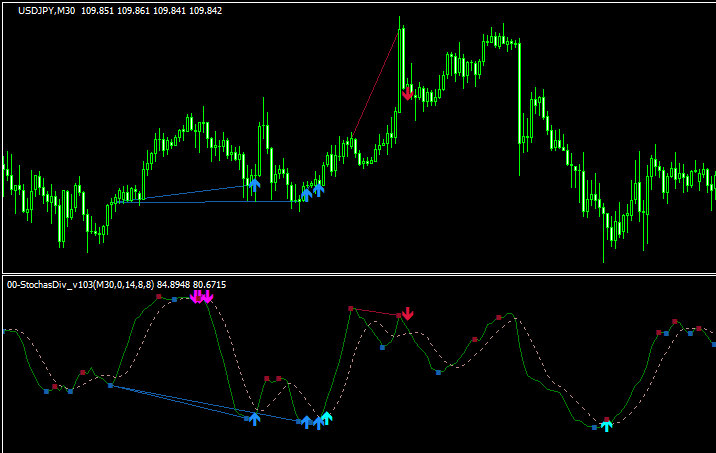
ストキャスティクスのダイバージェンスを示す「00-StochasDiv_v103」
勝てる手法10個+超凄いインジをプレゼント!

\初心者から上級者まで大注目!/
当サイト限定で、XMの口座開設をすると「Forex Standard Club XM版」へ無料招待!
✔️ 期間限定で13,000円のボーナス!
✔️ 最大500ドルまで100%入金ボーナス!
✔️ 勝率を上げるトレード手法&限定インジケーターを多数提供!
将来の動きを予測する無料ツール差し上げます

未来予測インジケーター「Futuro FX」は、過去の動きと現在の動きの相関から少し先の動きを予測します。メルマガ登録で詳しい解説書をプレゼント!
さらにスマートマネーコンセプト(SMC)について解説したPDFもプレゼント!
\初心者から上級者まで大注目!/
当サイト限定で、XMの口座開設をすると「Forex Standard Club XM版」へ無料招待!
✔️ 13,000円のボーナス!
✔️ 最大1000ドルまで100%入金ボーナス!
✔️ 勝率を上げるトレード手法&限定インジケーターを多数提供!