
 バンドタイプ
MTF
バンドタイプ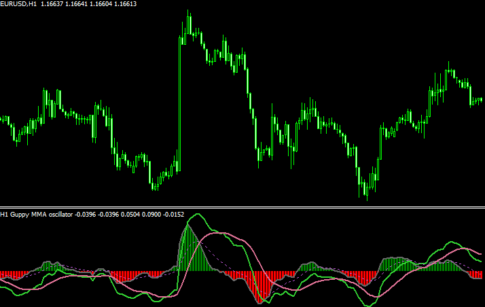 オシレーター
GMMAをオシレーター化した「Guppy MMA – oscillator (mtf + lines + alerts + arrows) 」
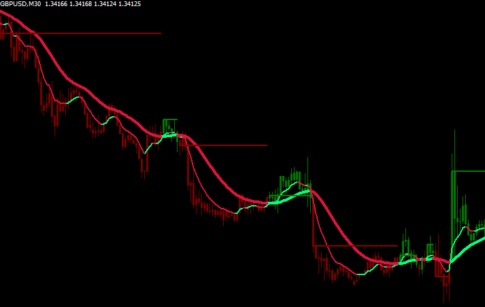
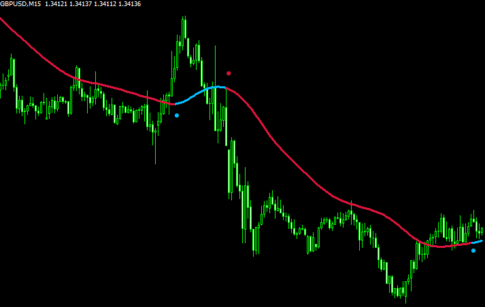 移動平均線タイプ
ATRを利用してトレンド方向を示す「ATR Based Zigzag w avgs (mtf + alerts + arrows)」
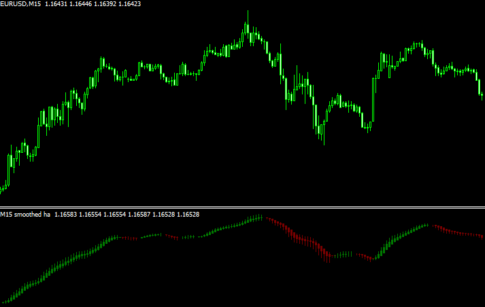 平均足
平均足サブチャートに平均足/平均足スムーズドを表示する「heiken ashi (simple) sw BT」
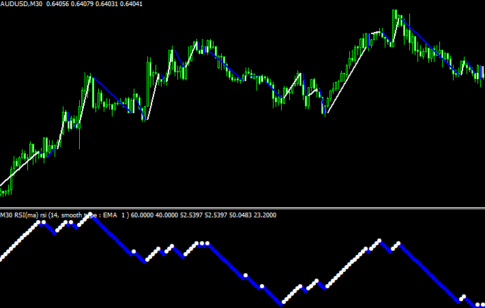
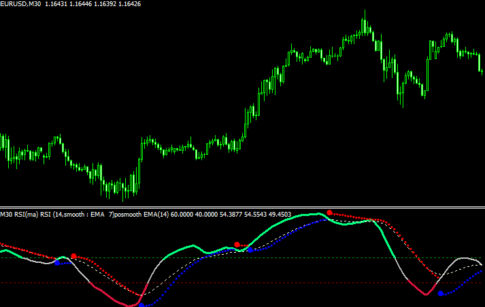 オシレーター
RSIにパラボリックを表示する「xRsi(ma + sar)」
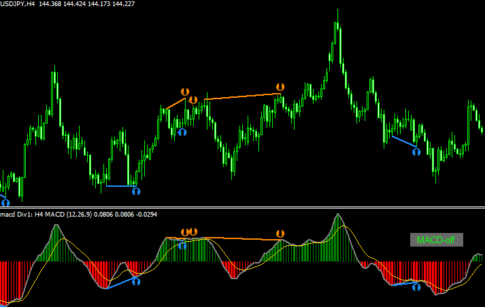 オシレーター
MACDのダイバージェンスを認識する「!!!macd – all colored (mtf + arrows + alerts + divergence + btn)」
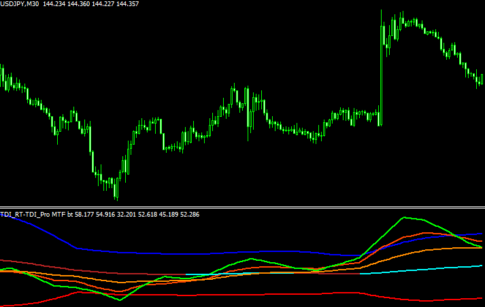 オシレーター
TDIをベースとしてマルチタイムにも対応した「TDI_RT-TDI_Pro MTF bt」
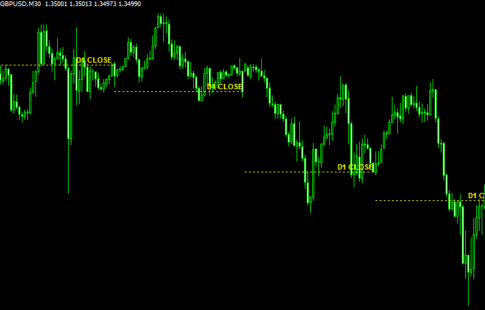 ラインタイプ
指定した時間足の終値などをラインで表示する「OHLC_MTF_Lines」
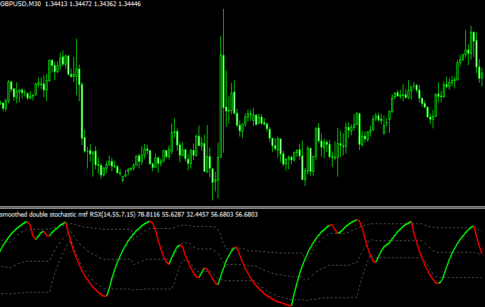 オシレーター
RSIをストキャスで2回スムーズドした「Double Stochastic – RSI (mtf + arrows + alerts)」
 移動平均線タイプ
2本の移動平均線を使ってトレンド方向を分かりやすく示す「ribbon (+eAverages)」
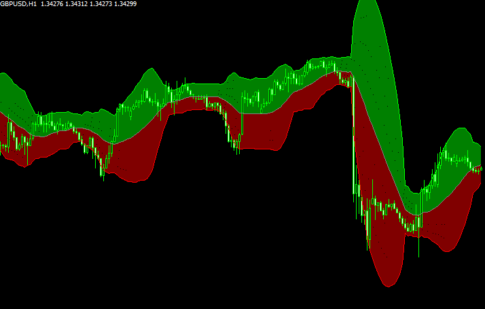
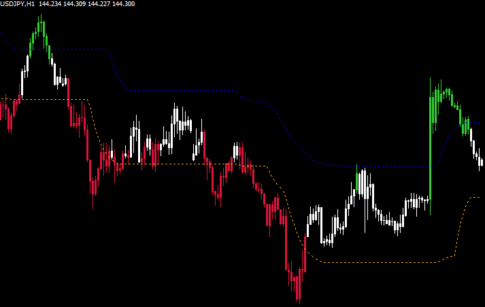 バンドタイプ
ハイローバンドを平均化したものをブレイクしたらサインが出る「hott lott (mod)」
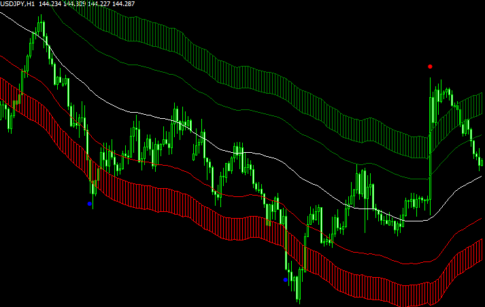 バンドタイプ
機能が充実したSTARC BAND「STARC Bands mtf BT(+fill)」
 オシレーター
RSIを利用して波を表示してトレンド方向を示す「xRsi(+ma) trend 1.1」
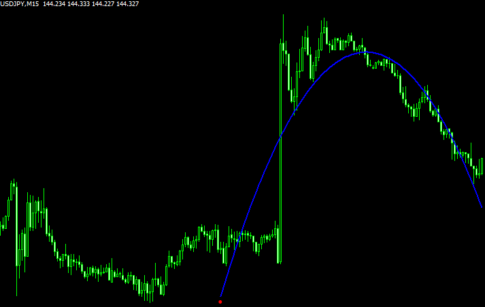 相場状況表示
相場の流れを大まかに示す「ang_PR_lDinn-v1」
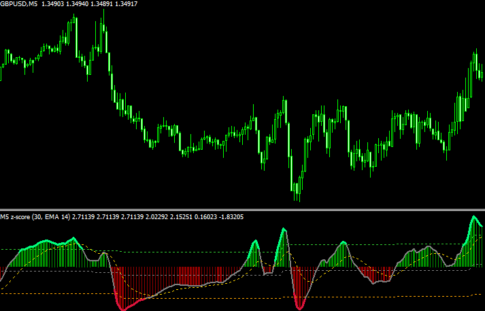 オシレーター
標準偏差を利用したオシレーター「z-score eAverages 1.2」
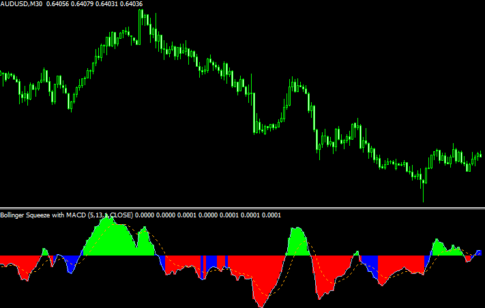 オシレーター
スクイーズの状態がマルチタイムで分かる「bollinger-squeeze-with-macd (mtf + signal)」
勝てる手法10個+超凄いインジをプレゼント!

\初心者から上級者まで大注目!/
当サイト限定で、XMの口座開設をすると「Forex Standard Club XM版」へ無料招待!
✔️ 期間限定で13,000円のボーナス!
✔️ 最大500ドルまで100%入金ボーナス!
✔️ 勝率を上げるトレード手法&限定インジケーターを多数提供!
将来の動きを予測する無料ツール差し上げます

未来予測インジケーター「Futuro FX」は、過去の動きと現在の動きの相関から少し先の動きを予測します。メルマガ登録で詳しい解説書をプレゼント!
さらにスマートマネーコンセプト(SMC)について解説したPDFもプレゼント!
\初心者から上級者まで大注目!/
当サイト限定で、XMの口座開設をすると「Forex Standard Club XM版」へ無料招待!
✔️ 13,000円のボーナス!
✔️ 最大1000ドルまで100%入金ボーナス!
✔️ 勝率を上げるトレード手法&限定インジケーターを多数提供!