
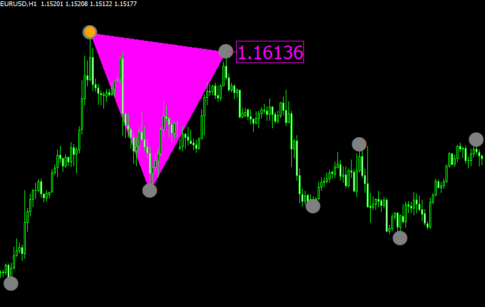
 パターン認識
MTF
パターン認識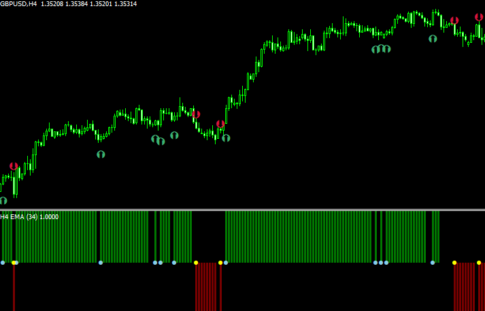 バータイプ
バータイプMAチャネルとの関係性を示してサインも出す「price cross(ud+dn+shift+arrows) eAverages 」
 ラインタイプ
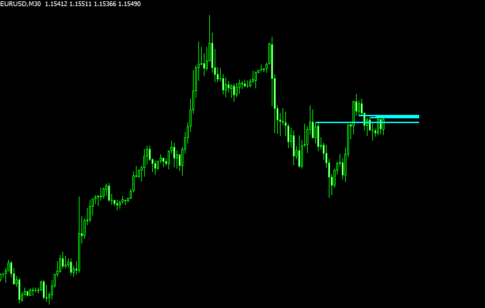
Bid価格に最も近い高値・安値からラインを引く「ClosestLevelsPlotter」
 オシレーター
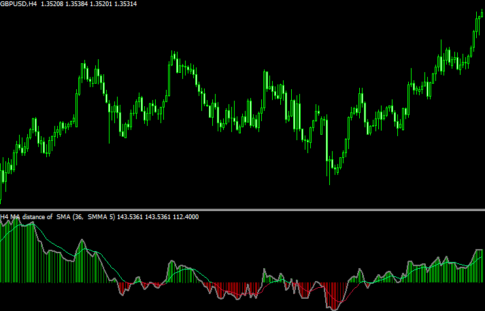
MAと価格の距離を示すオシレーター「! Ma distance + signal eAverages 1.1」
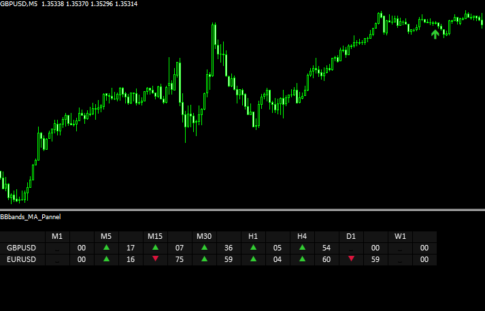 相場状況表示
ボリバンとMAのクロスでサインを出して一覧で示す「BBbands_MA_Pannel」
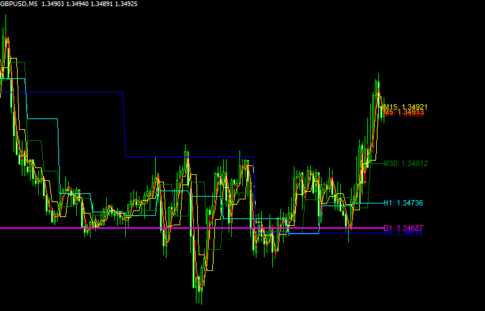 ラインタイプ
マルチタイムでサポレジラインを表示する「AllTimeframes SR」
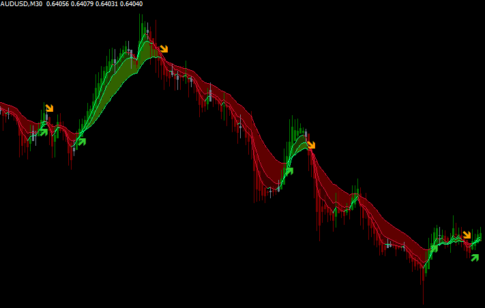
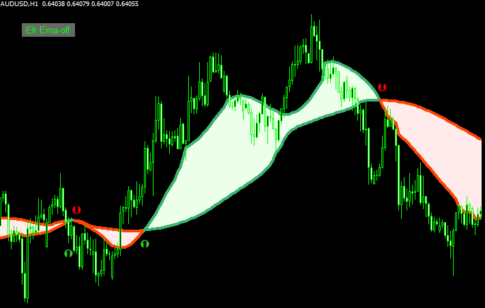 移動平均線タイプ
2本のEMAでリボンを示す「! Efr ema variation ribbon (mtf + arrows + alerts)」
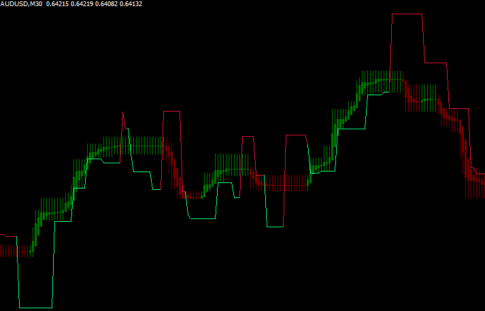
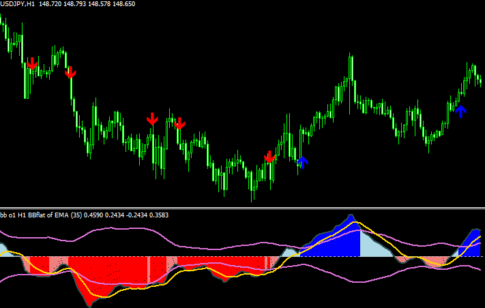 オシレーター
様々な機能に対応したBBフラット「! BB – flat sw avgs histo (mtf + alerts + arrows + fill)」
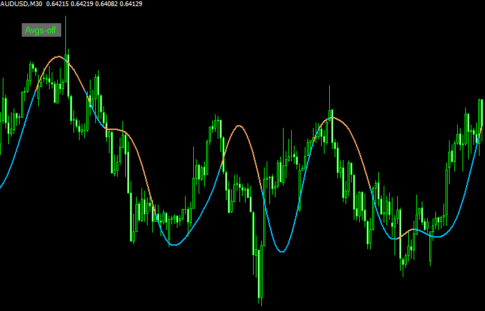 移動平均線タイプ
MT4にはない時間足のMAも表示できる「avgs – (any timeframe)」
 平均足
平均足平均足と3本のMAを表示してオンオフできる「Heiken Ashi (+ 3ma ribbon + mtf) BT」
 平均足
平均足平均足とハーフトレンドを組み合わせた「halftrend heiken ashi」
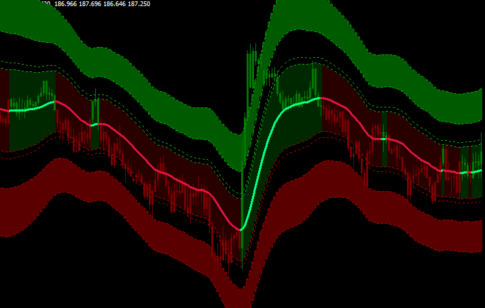 バンドタイプ
RMAとATRバンドを表示する「RMAs (adaptive + filtered +fibo +BT)1.2」
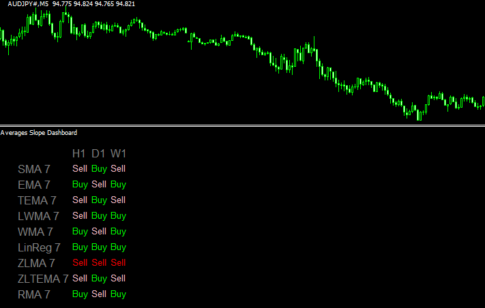 相場状況表示
マルチタイムで9つのMAの方向を示す「Averages_Slope_Dashboard」
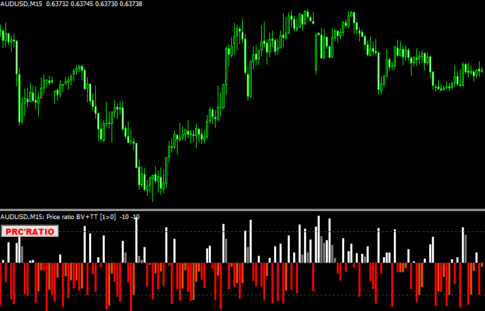 オシレーター
直近の相場の勢いを示す「Price ratio BV+TT」
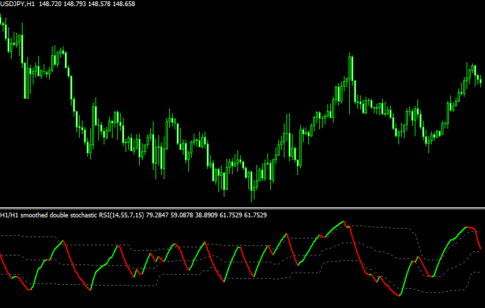 オシレーター
RSIの値を2回ストキャス化したダブルストキャスRSIを表示する「Double Stochastic RSI multicolor filtered 2.0 」
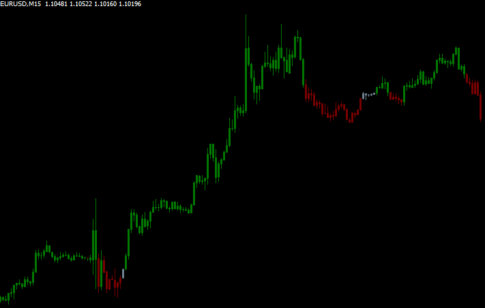 ローソク足
ローソク足レンジとトレンドをローソク足の色に反映する「TTM BT」
勝てる手法10個+超凄いインジをプレゼント!

\初心者から上級者まで大注目!/
当サイト限定で、XMの口座開設をすると「Forex Standard Club XM版」へ無料招待!
✔️ 期間限定で13,000円のボーナス!
✔️ 最大500ドルまで100%入金ボーナス!
✔️ 勝率を上げるトレード手法&限定インジケーターを多数提供!
将来の動きを予測する無料ツール差し上げます

未来予測インジケーター「Futuro FX」は、過去の動きと現在の動きの相関から少し先の動きを予測します。メルマガ登録で詳しい解説書をプレゼント!
さらにスマートマネーコンセプト(SMC)について解説したPDFもプレゼント!
\初心者から上級者まで大注目!/
当サイト限定で、XMの口座開設をすると「Forex Standard Club XM版」へ無料招待!
✔️ 13,000円のボーナス!
✔️ 最大1000ドルまで100%入金ボーナス!
✔️ 勝率を上げるトレード手法&限定インジケーターを多数提供!