
 平均足
平均足○○足
平均足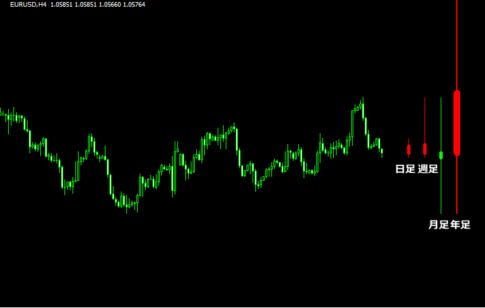 ローソク足
ローソク足チャート右に現在の上位足を表示する「mtf_visualization_v1_5_1」
 平均足
平均足平均足と3本のMAを表示してサインを出す「Heiken Ashi (+ 3ma ribbon + mtf) 」
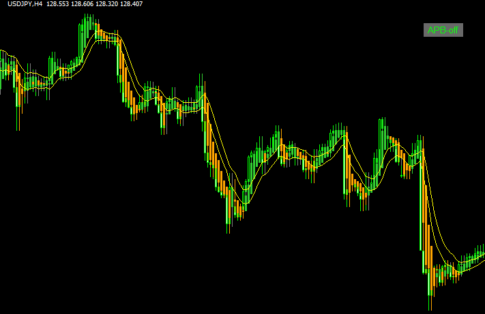
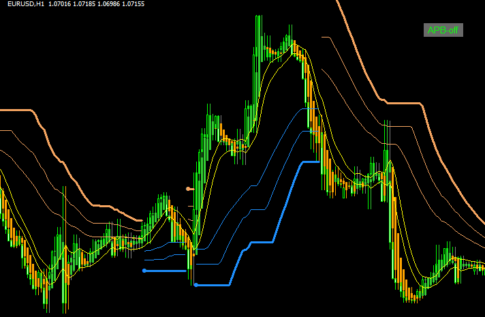 平均足
平均足APBにBBストップを追加した「APB – avgs candles – bb stops (mtf + btn + lb)」
 平均足
平均足APBとMA表示しサインも出す「HA ( apb + cross ma ) 1.1」
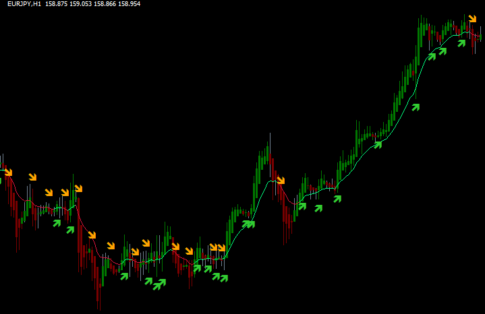
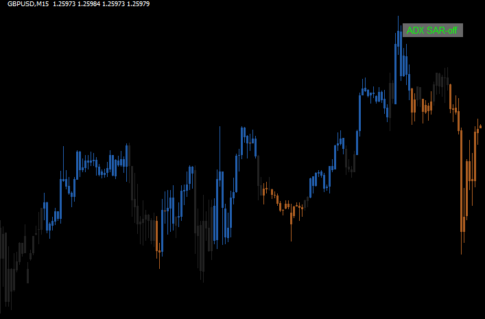 トレンド表示型
ADXとパラボリックでトレンド方向を示す「!!!-MT4 X-XARDg-ADX SAR (btn)」
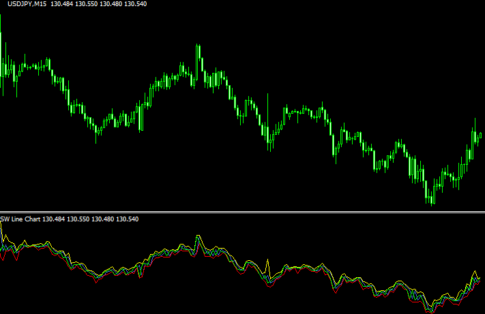 ラインタイプ
サブチャートにラインチャートを表示する「Subwindow_Line_Chart」
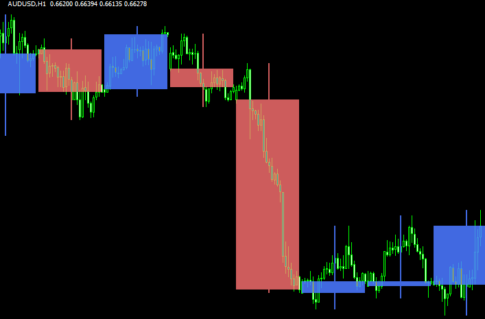 ローソク足
ローソク足特定の曜日の上位足を重ねて表示する「bigger-tf-candles-week-day」
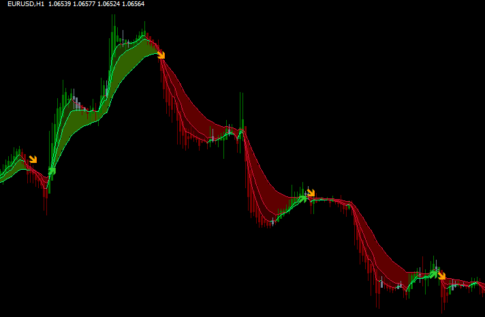
 平均足
平均足APBと平均足チャネルを表示する「APB – averages Candles (mtf + btn)」
 平均足
平均足平均足スムーズドの方向をローソク足の色に反映する「heiken ashi smoothed (alerts +mtf + jcandles) BT」
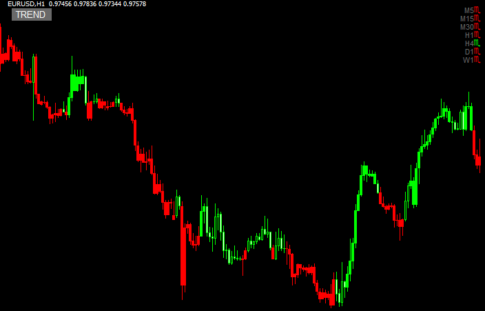 トレンド表示型
マルチタイムで相場の方向を示す「MTF_TrendBar BT」
 平均足
平均足マルチタイムで平均足を表示する「heiken_ashi_-_mtf_on_chart_nmc」
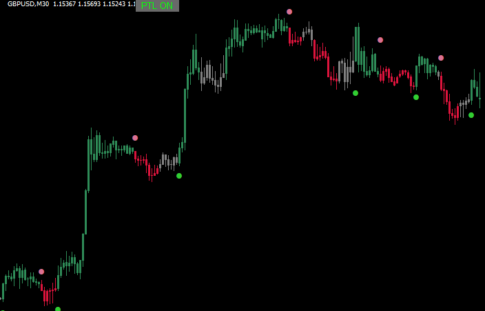 トレンド表示型
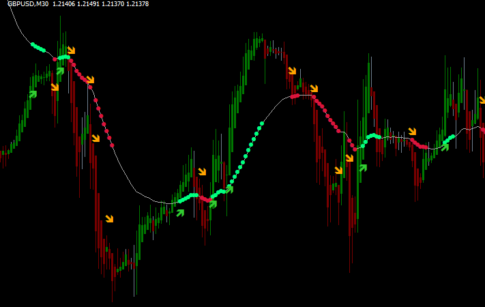
トレンド方向をドットとローソク足の色で示す「ptl 3 BT」
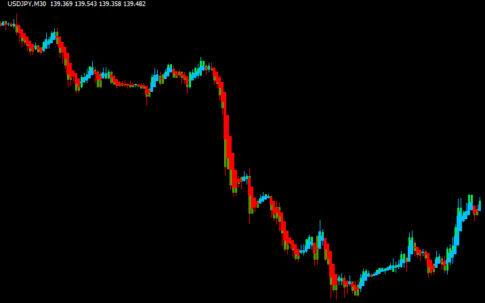
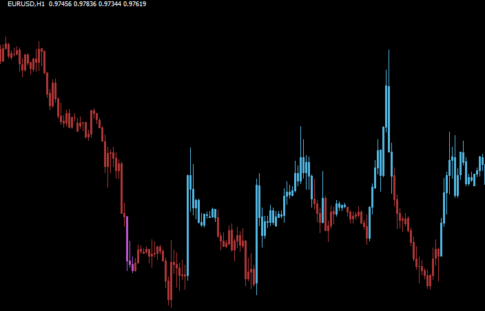 トレンド表示型
RSIの状況をローソク足の色に反映する「Rsi MTF candles_2 autowidth AA2」
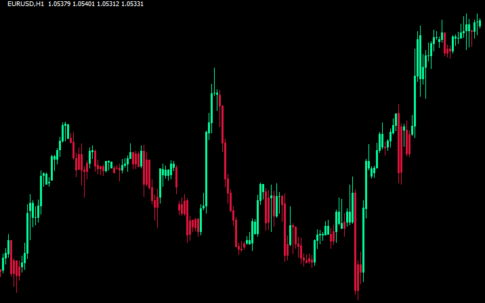
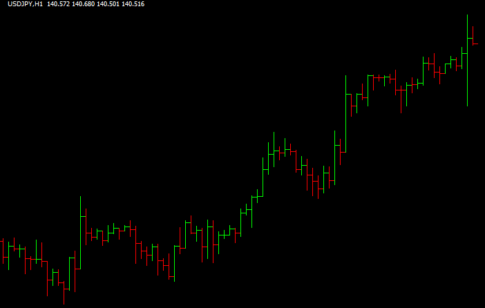 バーチャート
陽線・陰線で色を変えるバーチャート「Close_only_bar_chart」
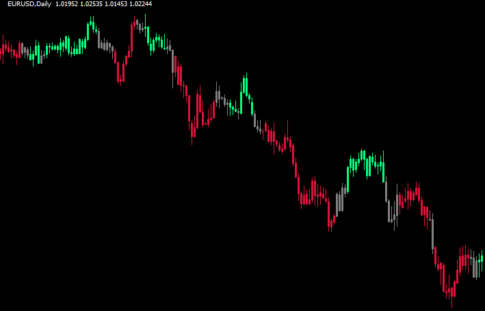 トレンド表示型
SZOを利用してトレンド方向を示す「SZO CANDLES BT 1.2」
勝てる手法10個+超凄いインジをプレゼント!

\初心者から上級者まで大注目!/
当サイト限定で、XMの口座開設をすると「Forex Standard Club XM版」へ無料招待!
✔️ 期間限定で15,000円のボーナス!
✔️ 最大500ドルまで100%入金ボーナス!
✔️ 勝率を上げるトレード手法&限定インジケーターを多数提供!
将来の動きを予測する無料ツール差し上げます

未来予測インジケーター「Futuro FX」は、過去の動きと現在の動きの相関から少し先の動きを予測します。メルマガ登録で詳しい解説書をプレゼント!
さらにウォルフ波動を使ったトレード手法解説と本当に使えるウォルフ波動を認識するインジケーターもメルマガ内でご紹介します!
\初心者から上級者まで大注目!/
当サイト限定で、XMの口座開設をすると「Forex Standard Club XM版」へ無料招待!
✔️ 13,000円のボーナス!
✔️ 最大1000ドルまで100%入金ボーナス!
✔️ 勝率を上げるトレード手法&限定インジケーターを多数提供!