
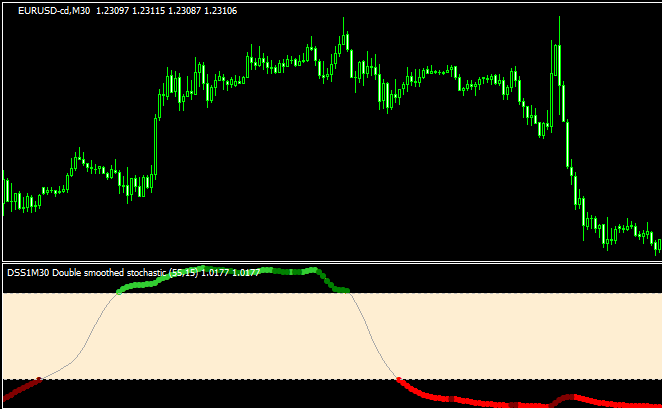
 オシレーター
サブチャート
オシレーター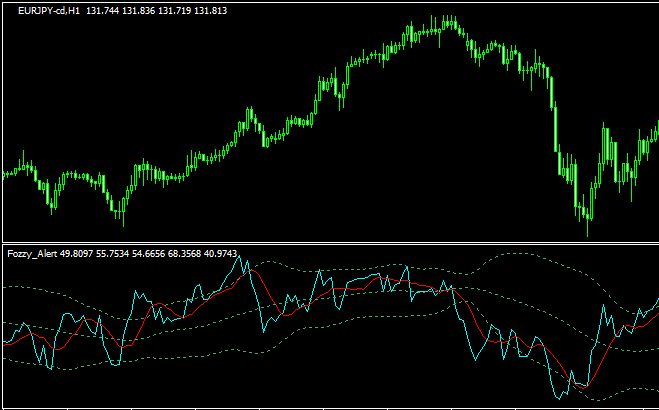 オシレーター
RSIをボリバン化した「Fozzy_Alert」
 オシレーター
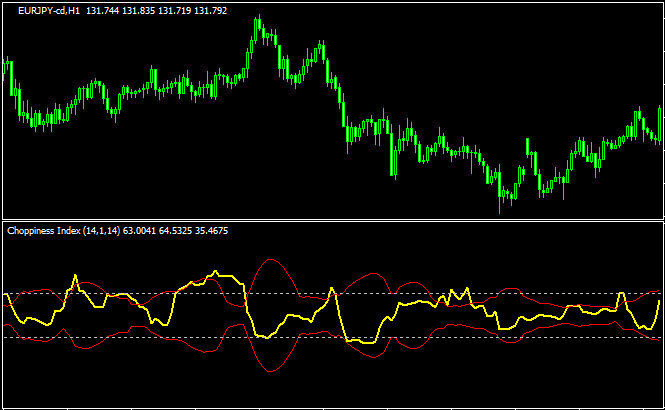
ボリバンのようなオシレーター「Choppiness Index」
 オシレーター
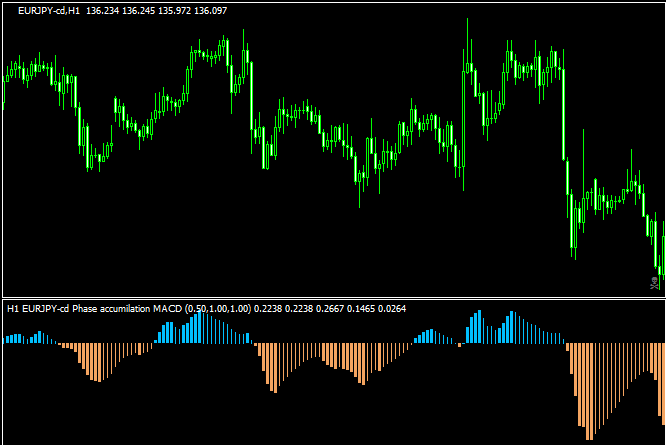
MACDの派生型「phase-accumulation-macd」
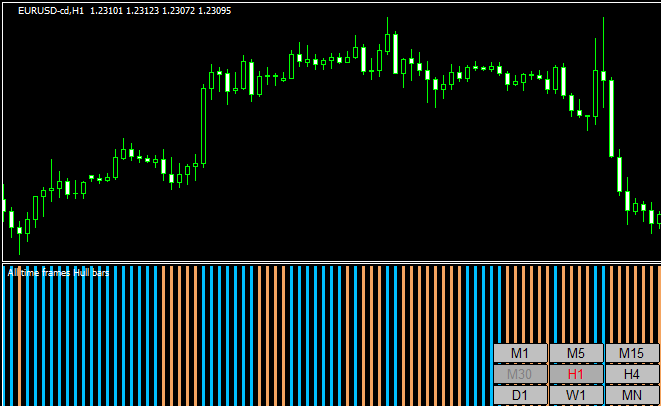 バータイプ
バータイプマルチタイムでHMAが上向きか下向きか分かる「All time frame Hull bars」
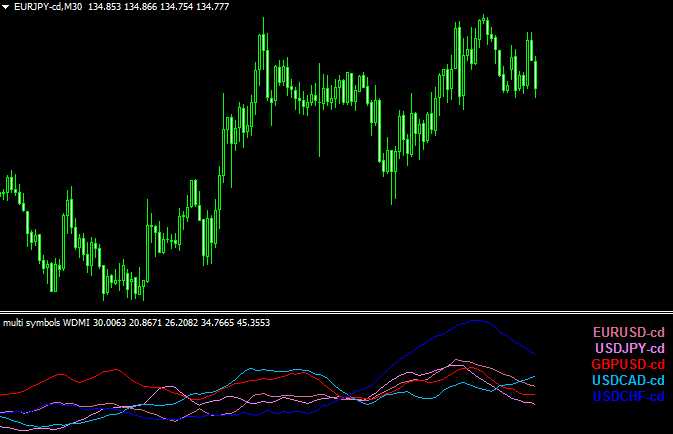 オシレーター
複数通貨ペアのADXを同時に表示「Multi symbols Wilders DMI」
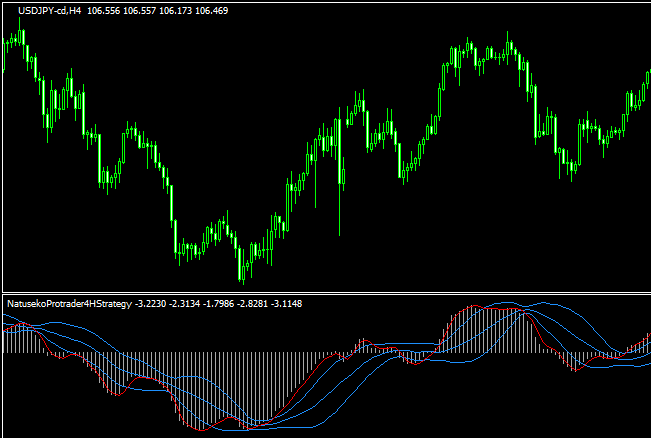 オシレーター
ボリバンとMACDの融合「NatusekoProtrader4HStrategy]
 オシレーター
ダイバージェンス愛好家のための「all in one divergence indicator」
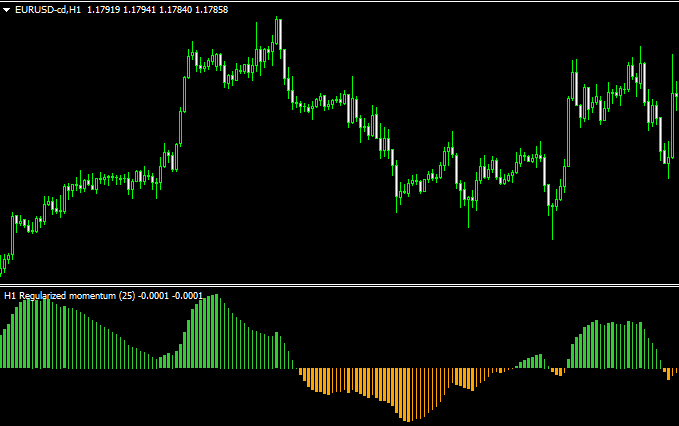 オシレーター
わかりやすくてマルチタイムに対応したモーメンタム「Regularized momentum histo mtf alerts nmc」
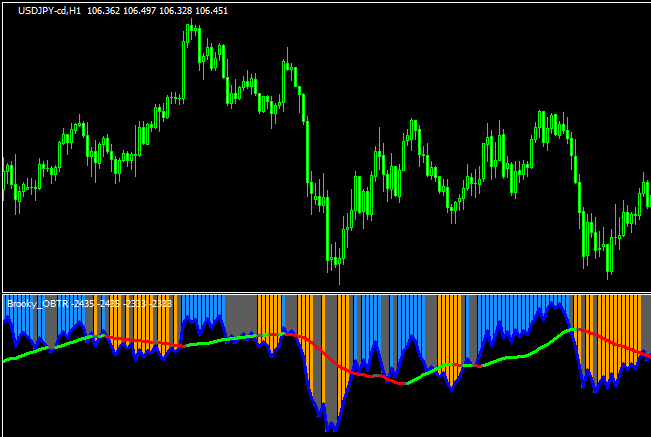 Volume
On Balance Volumeを更に見やすくした「OBTR」
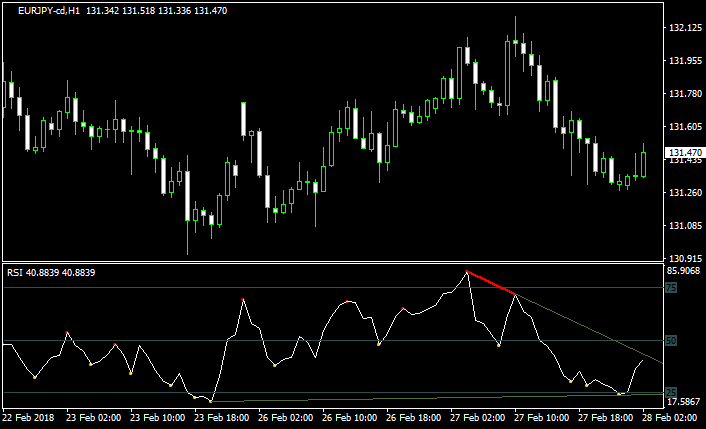
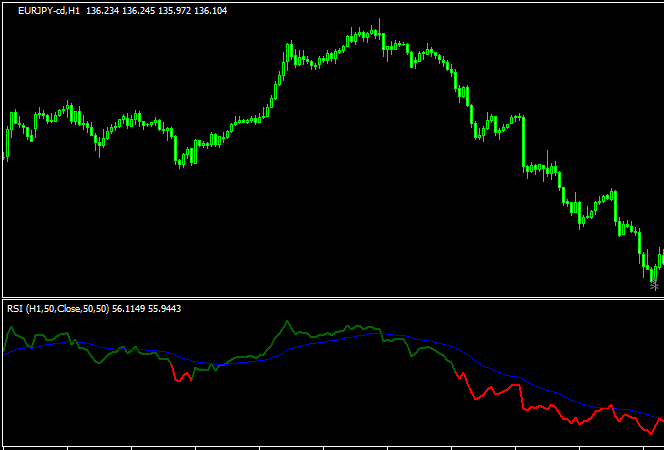 オシレーター
値によって色が変わりマルチタイムも可能なRSI 「color rsi with ema」
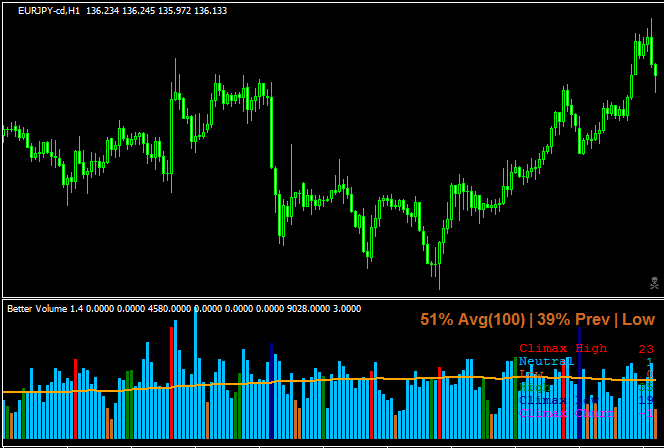 Volume
ボリュームに様々な情報を持たせた「BetterVolume-1.4_TRO_MODIFIED_VERSION」
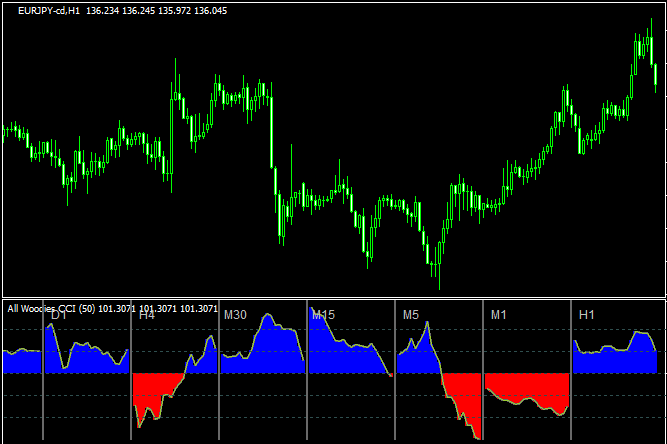 オシレーター
「woodies-cci」をマルチタイム表示する「all-woodies-cci」
 オシレーター
トレンドの反転を捉えるのに使えそうな「afl-winner-indicator」
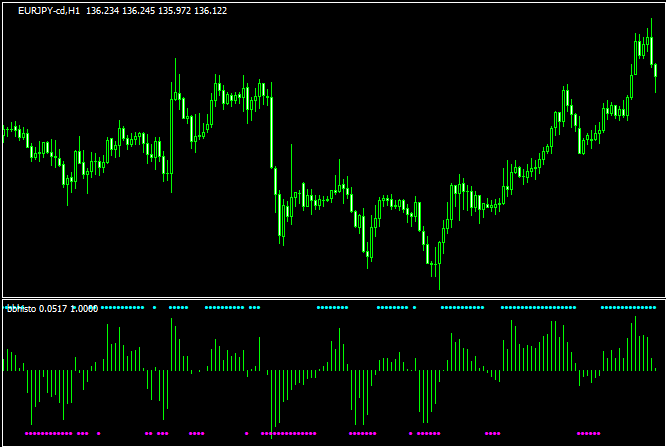 オシレーター
ローソク足とボリバンの位置関係をヒストグラム化した「bbhisto」
 オシレーター
3つの期間のATR LWMAを示す「atr_3lwma」
勝てる手法10個+超凄いインジをプレゼント!

\初心者から上級者まで大注目!/
当サイト限定で、XMの口座開設をすると「Forex Standard Club XM版」へ無料招待!
✔️ 期間限定で13,000円のボーナス!
✔️ 最大500ドルまで100%入金ボーナス!
✔️ 勝率を上げるトレード手法&限定インジケーターを多数提供!
将来の動きを予測する無料ツール差し上げます

未来予測インジケーター「Futuro FX」は、過去の動きと現在の動きの相関から少し先の動きを予測します。メルマガ登録で詳しい解説書をプレゼント!
さらにスマートマネーコンセプト(SMC)について解説したPDFもプレゼント!
\初心者から上級者まで大注目!/
当サイト限定で、XMの口座開設をすると「Forex Standard Club XM版」へ無料招待!
✔️ 13,000円のボーナス!
✔️ 最大1000ドルまで100%入金ボーナス!
✔️ 勝率を上げるトレード手法&限定インジケーターを多数提供!