
 その他
その他その他
その他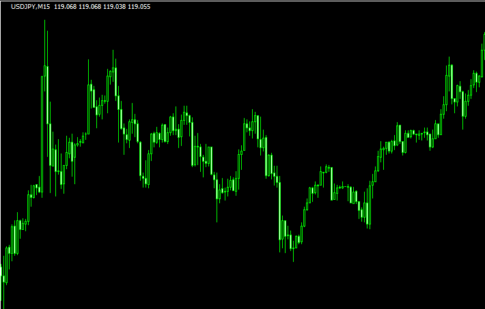 その他
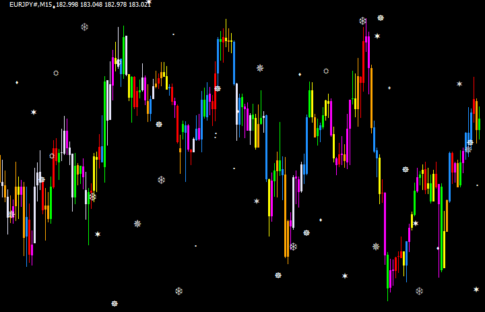
その他チャートの枠と価格や時間スケールを消す「Time Price Frame Hide」
 その他
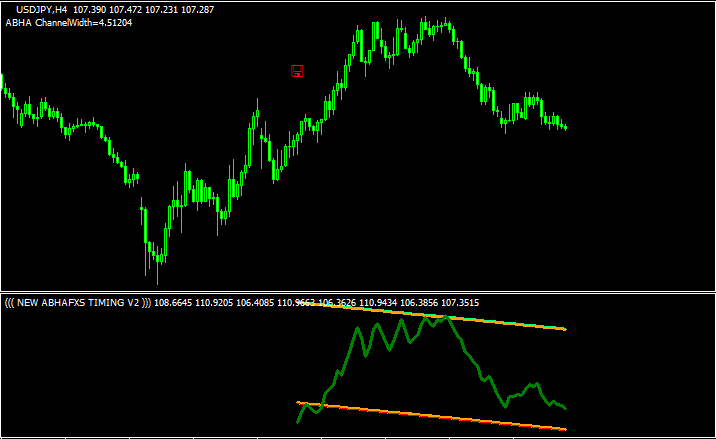
その他チャート下にチャネルラインが表示される「NEW ABHAFXS TIMING V2L」
 その他
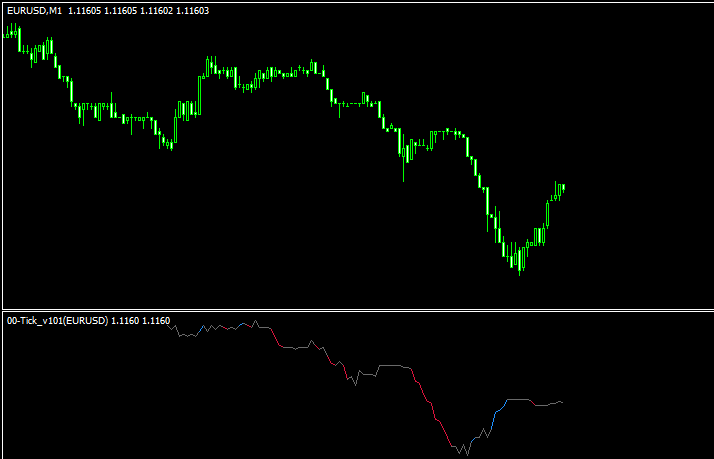
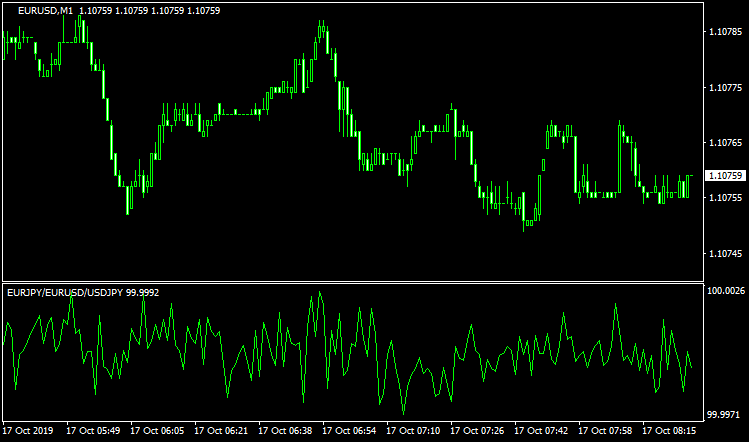
その他他の通貨ペアのティックも表示できる「00-Tick_v101」
 その他
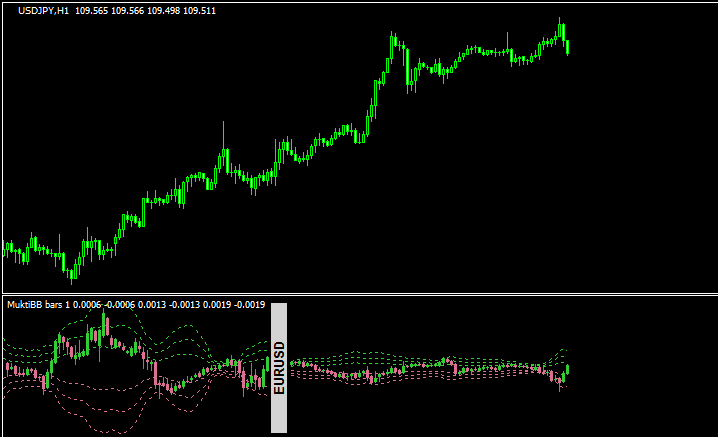
その他複数の通貨ペアのローソク足とボリバンが表示される「multi_pair_bollinger_band_bars_2」
 その他
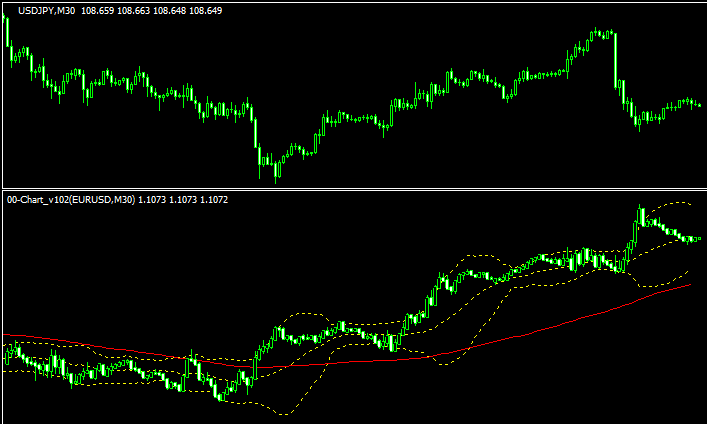
その他他の通貨ペアのチャートをサブチャートに表示する「00-Chart_v102」
 その他
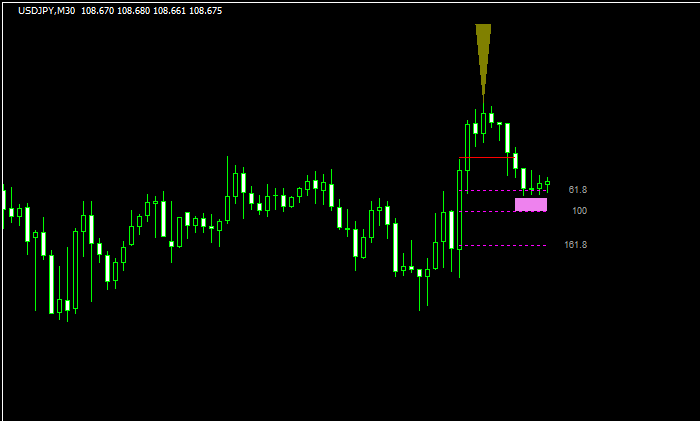
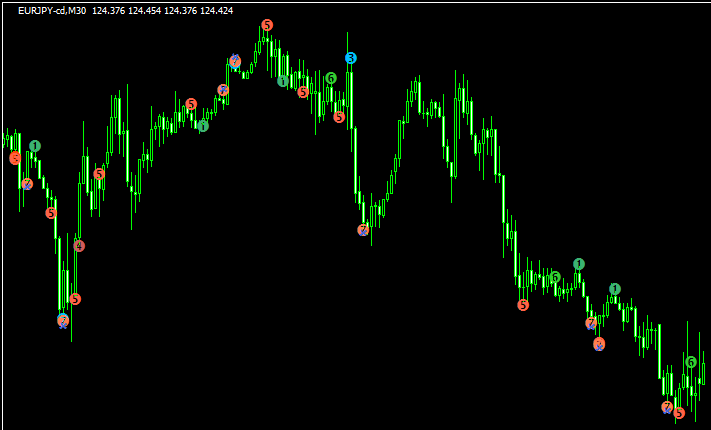
その他相場の転換点と、それがどこまで伸びるかの目安を示す「MTF Hurst Target 1.06」
 その他
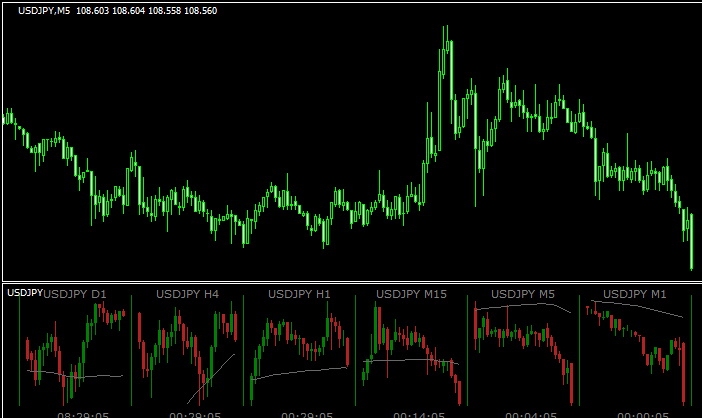
その他チャート下に他の時間足のチャートが表示出来る「pipware-charts-v6.2」
 その他
その他三角アービトラージのチャンスを検証できる「00-Arbitrage」
 その他
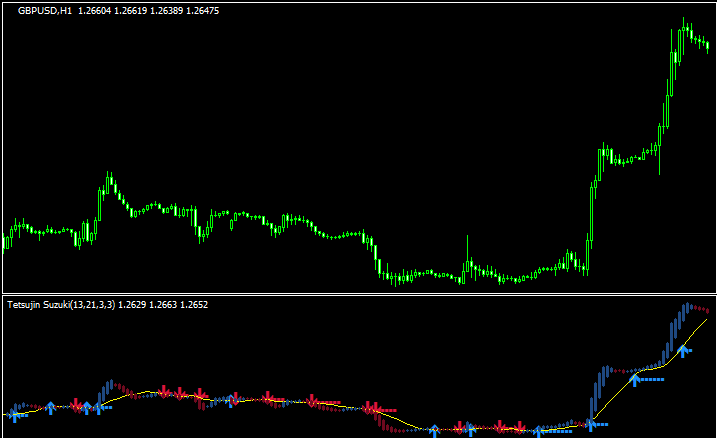
その他トレンドフォロー用のサインが出る「Tetsujin Suzuki」
 その他
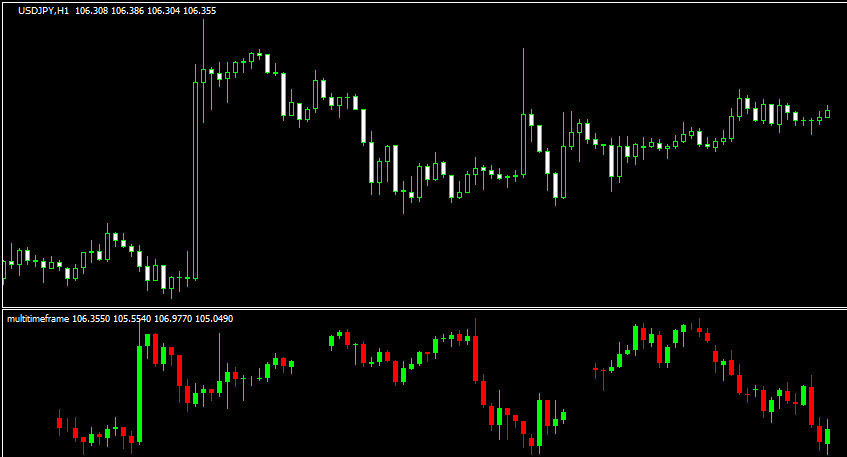
その他マルチタイムでローソク足の状況が確認できる「multitimeframe」
 その他
その他トレンドの反転ポイントを見つける「WcciPaterns_Sep」
 その他
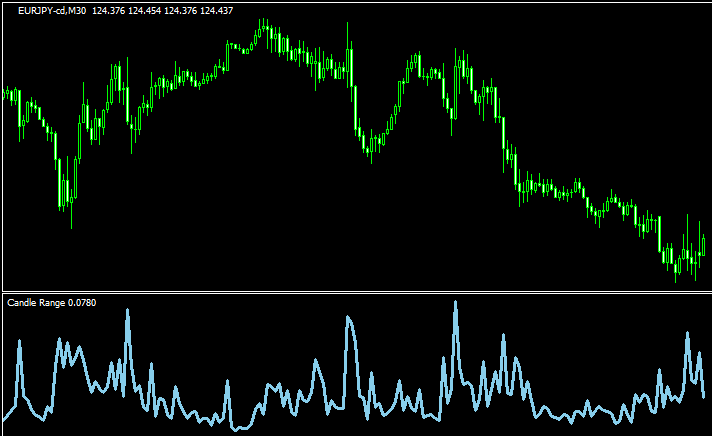
その他ローソク足の値幅の推移を示す「Candle_Range」
 その他
その他チャート下にもう一つローソク足チャートを表示させることの出来る「SecondChart」
 その他
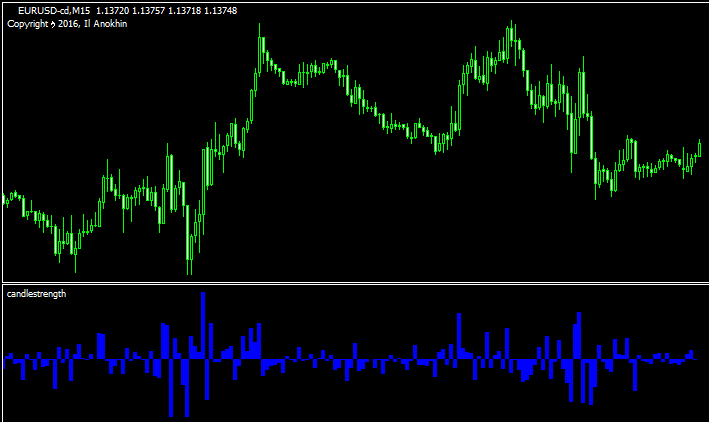
その他ローソク足の実体サイズを客観的に見られる「candlestrength」
 その他
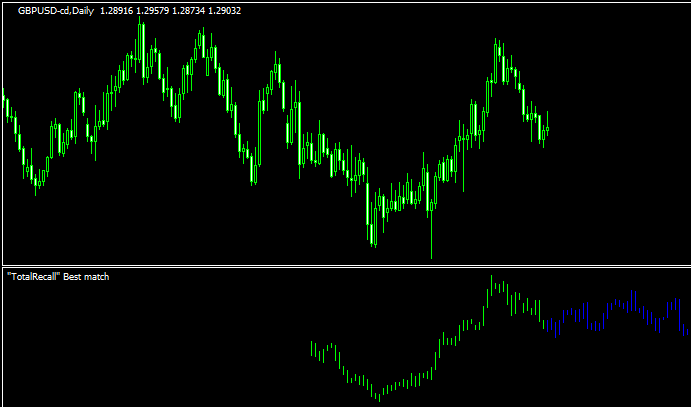
その他将来の動きを予測する「TotalRecall」
勝てる手法10個+超凄いインジをプレゼント!

\初心者から上級者まで大注目!/
当サイト限定で、XMの口座開設をすると「Forex Standard Club XM版」へ無料招待!
✔️ 期間限定で15,000円のボーナス!
✔️ 最大500ドルまで100%入金ボーナス!
✔️ 勝率を上げるトレード手法&限定インジケーターを多数提供!
将来の動きを予測する無料ツール差し上げます

未来予測インジケーター「Futuro FX」は、過去の動きと現在の動きの相関から少し先の動きを予測します。メルマガ登録で詳しい解説書をプレゼント!
さらにウォルフ波動を使ったトレード手法解説と本当に使えるウォルフ波動を認識するインジケーターもメルマガ内でご紹介します!
\初心者から上級者まで大注目!/
当サイト限定で、XMの口座開設をすると「Forex Standard Club XM版」へ無料招待!
✔️ 13,000円のボーナス!
✔️ 最大1000ドルまで100%入金ボーナス!
✔️ 勝率を上げるトレード手法&限定インジケーターを多数提供!