
 オシレーター
オシレーター
オシレーター オシレーター
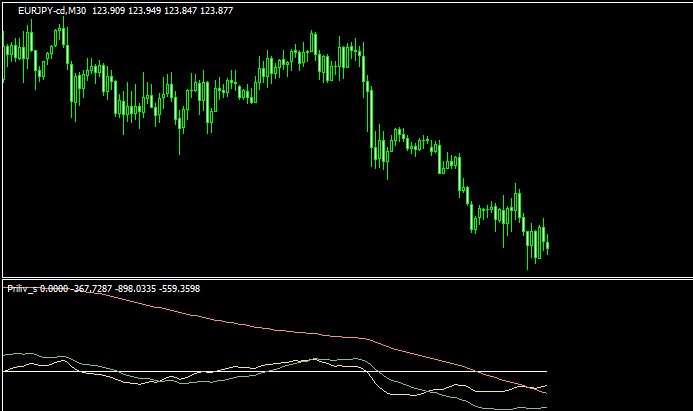
様々な移動平均の計算式でヒストグラムを表示する「AllAverages_v3.1_consensus」
 オシレーター
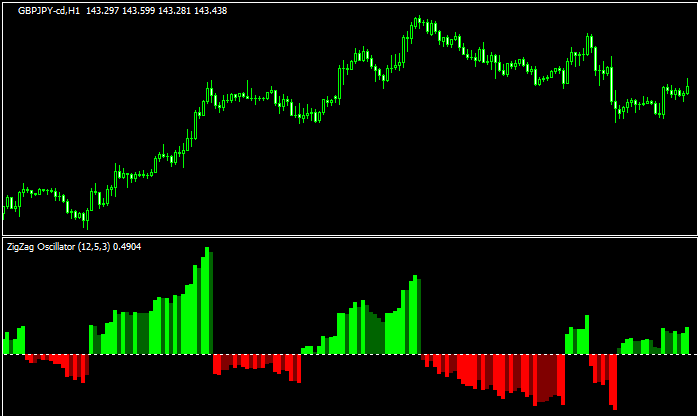
ジグザグをオシレーター化した「ZigZag_Oscillator」
 オシレーター
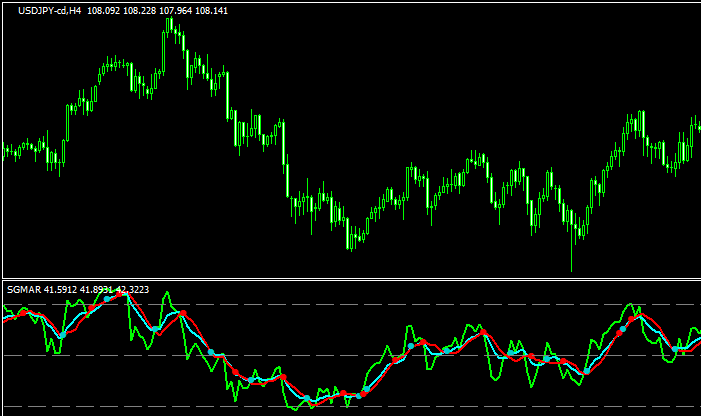
RSIをベースとした「SGMAR」
 オシレーター
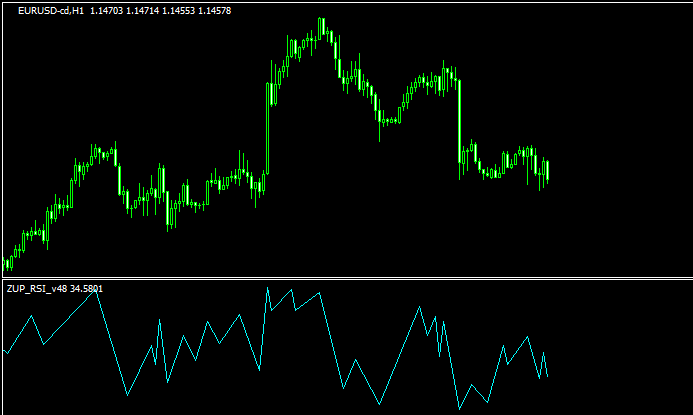
チャート下にジグザグのようなラインが表示される「ZUP_RSI_v48」
 オシレーター
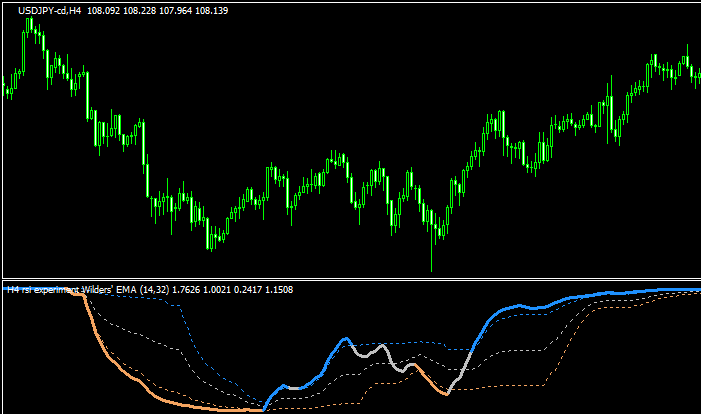
RSIをベースとした「rsi experiment extended averages – fl 1.4」
 オシレーター
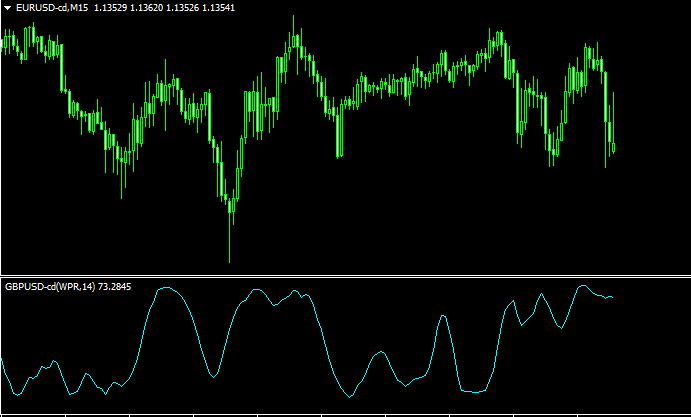
他の通貨ペアも表示出来るオシレーター「vinini-wpr-oscillator」
 オシレーター
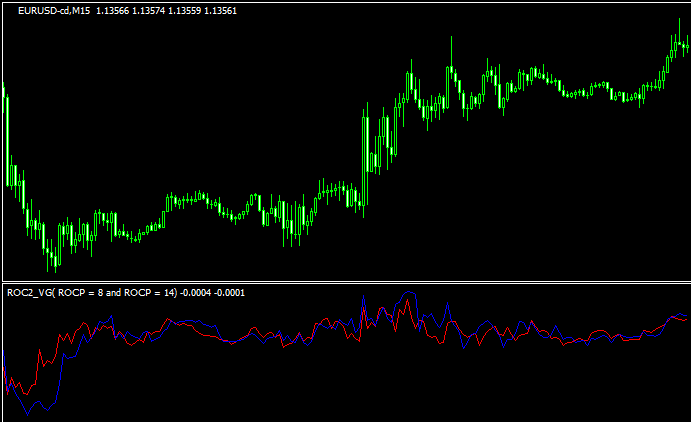
2本のROCを表示させる「ROC2_VG」
 オシレーター
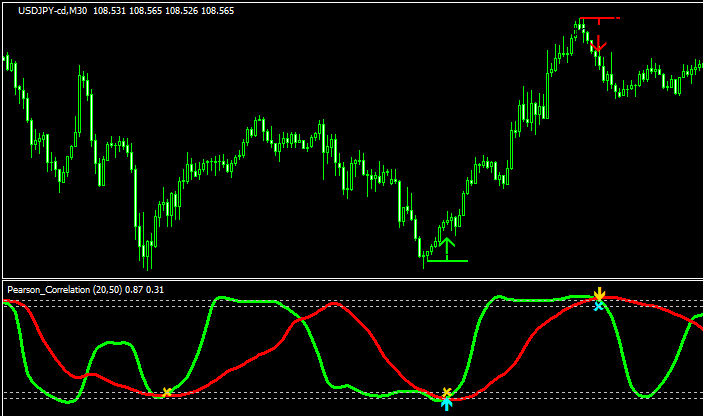
2本のRCI smoothedでサインを出す「pearson & spearman_smooth」
 オシレーター
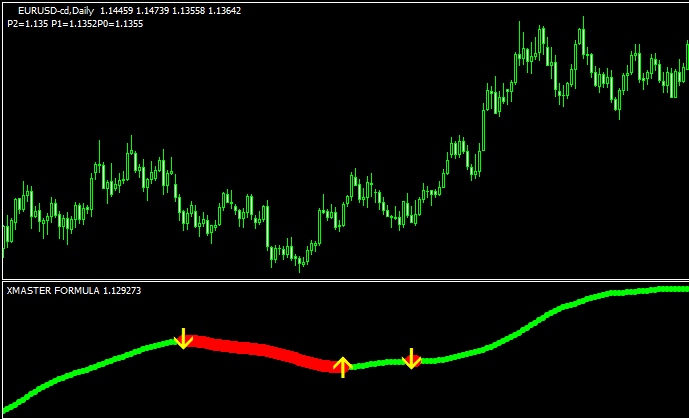
滑らかなオシレーター「xmaster-formula」
 オシレーター
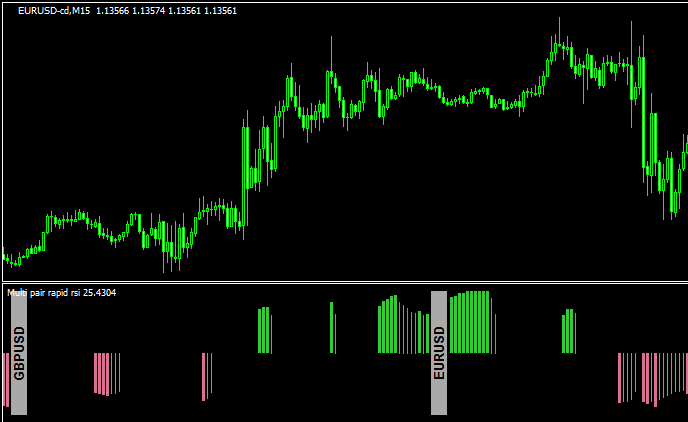
複数の通貨ペアでRapid Rsiを表示する「multi_pair_rapid_rsi_nmc」
 オシレーター
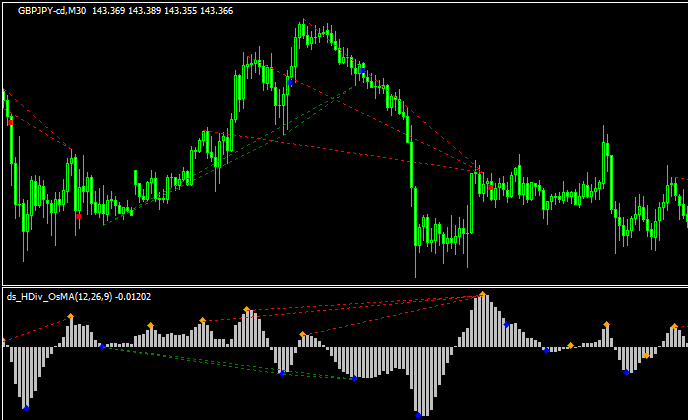
OsMAのヒドゥンダイバージェンスを検出する「ds_HDiv_OsMA_01」
 オシレーター
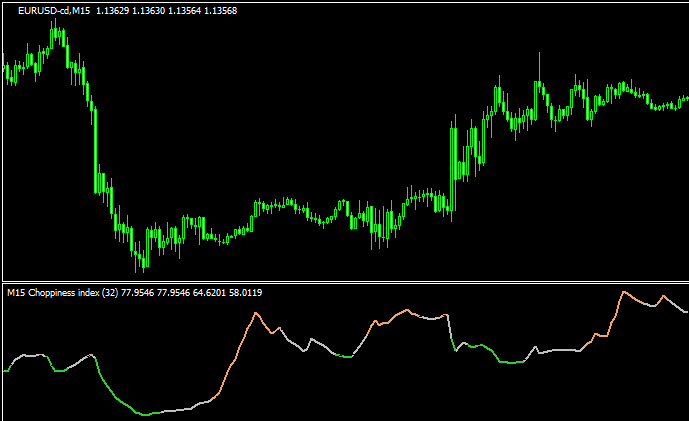
トレンドかレンジかを見極めるのに役立つ「choppiness index」
 オシレーター
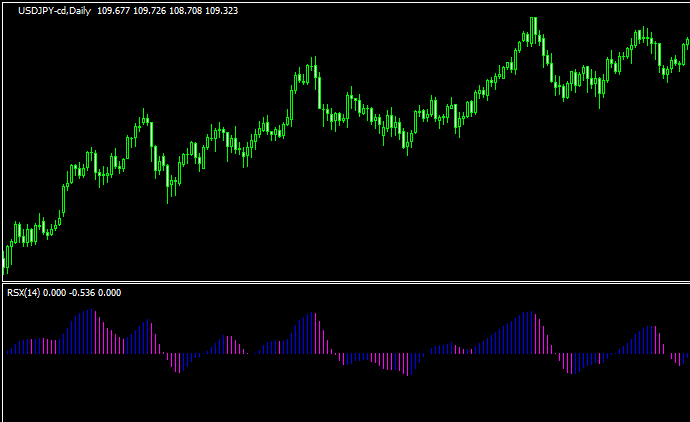
RSXをベースとしたヒストグラム「jrsx-oscillator」
 オシレーター
変なオシレーター?「StrangeIndicator」
 オシレーター
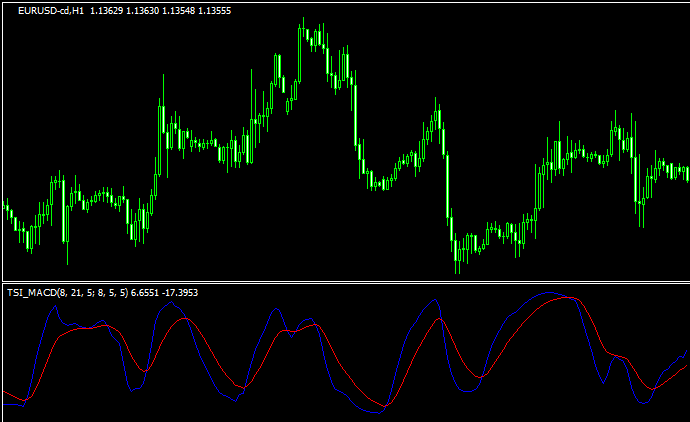
MACDをベースとした「tsi-macd」
勝てる手法10個+超凄いインジをプレゼント!

\初心者から上級者まで大注目!/
当サイト限定で、XMの口座開設をすると「Forex Standard Club XM版」へ無料招待!
✔️ 期間限定で13,000円のボーナス!
✔️ 最大500ドルまで100%入金ボーナス!
✔️ 勝率を上げるトレード手法&限定インジケーターを多数提供!
将来の動きを予測する無料ツール差し上げます

未来予測インジケーター「Futuro FX」は、過去の動きと現在の動きの相関から少し先の動きを予測します。メルマガ登録で詳しい解説書をプレゼント!
さらにスマートマネーコンセプト(SMC)について解説したPDFもプレゼント!
\初心者から上級者まで大注目!/
当サイト限定で、XMの口座開設をすると「Forex Standard Club XM版」へ無料招待!
✔️ 13,000円のボーナス!
✔️ 最大1000ドルまで100%入金ボーナス!
✔️ 勝率を上げるトレード手法&限定インジケーターを多数提供!