
 オシレーター
オシレーター
オシレーター オシレーター
上限や下限にへばり付きやすいオシレーター「SSRC」
 オシレーター
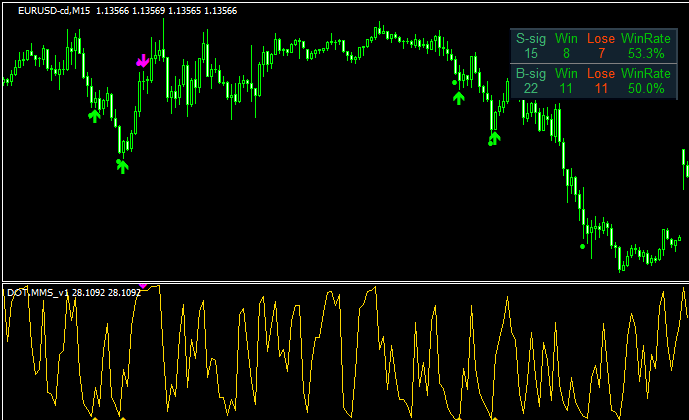
バイナリー用のシグナルで勝率も表示される「DOT.MMS」
 オシレーター
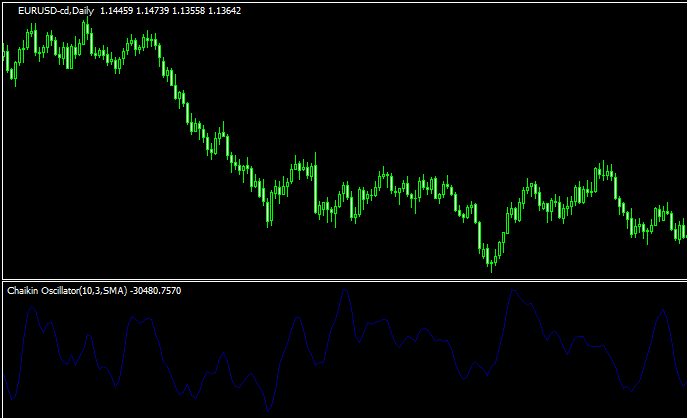
Accumulation/Distributionをベースとする「chaikin-oscillator」
 オシレーター
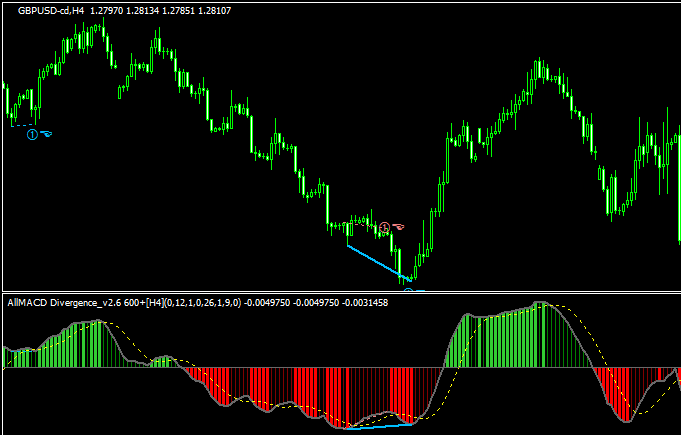
マルチタイムでMACDのダイバージェンスを表示する「AllMACD Divergence_v2.6 600+」
 オシレーター
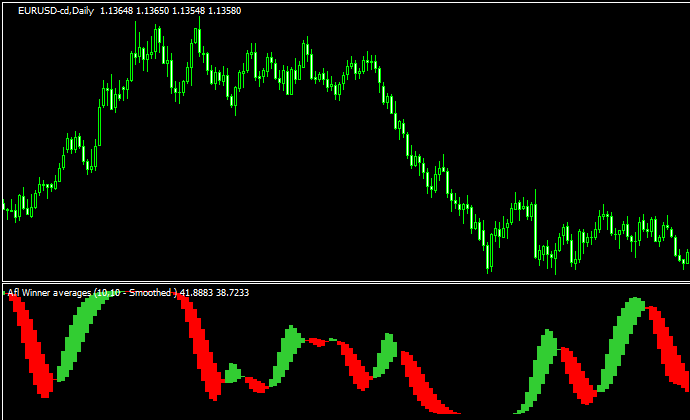
勢いの見えやすいオシレーター「afl_winner averages + alerts」
 オシレーター
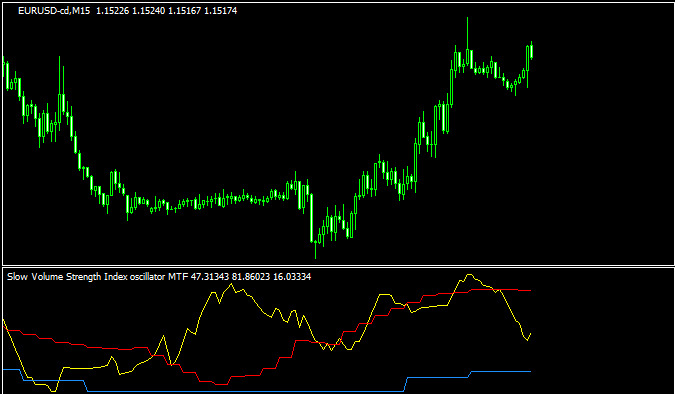
3つの時間軸で表示されるオシレーター「SVSI_MTF」
 オシレーター
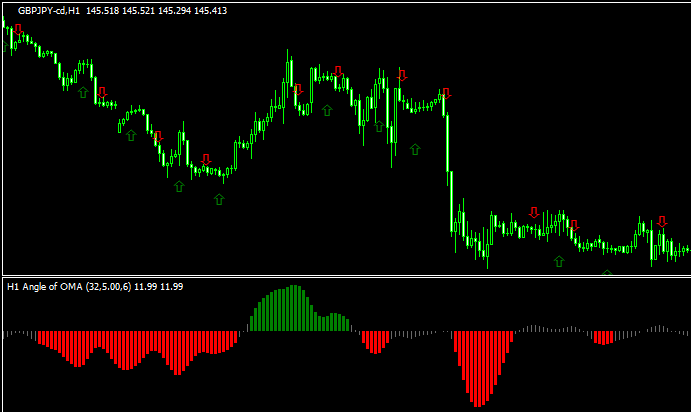
ヒストグラムの上下でサインが点灯する「angle of oma alerts arrows mtf」
 オシレーター
MACDをベースとした「Macd averages tape 1.1」
 オシレーター
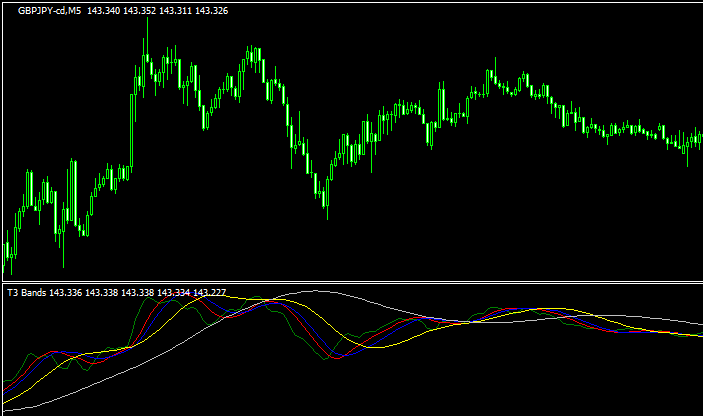
チャート下に複数のT3MAが表示される「T3_Bands2」
 オシレーター
MACDと一目均衡表を組み合わせた「Brooky_MACD_Ichimoku_V2」
 オシレーター
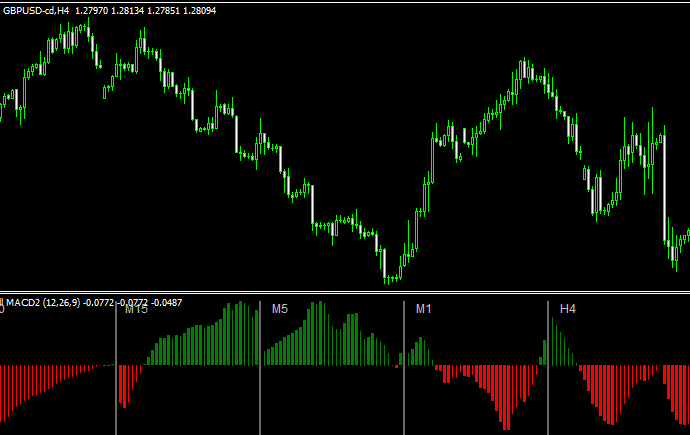
マルチタイムでMACDを表示させる「all_macd_v1.0_nmc_1」
 オシレーター
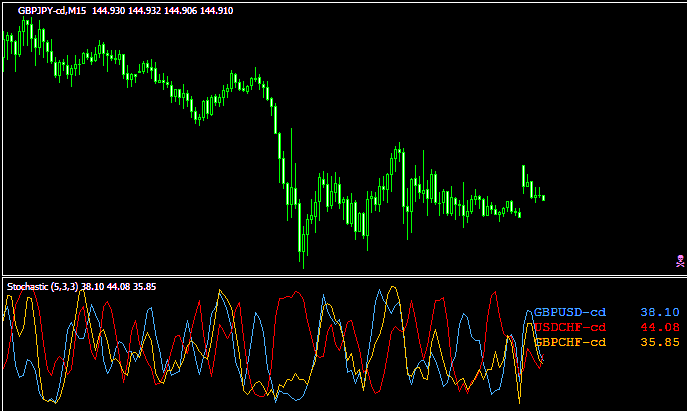
3つの通貨ペアのストキャスを同時に表示する「TRO_Stochastic_THREE_PAIRS」
 オシレーター
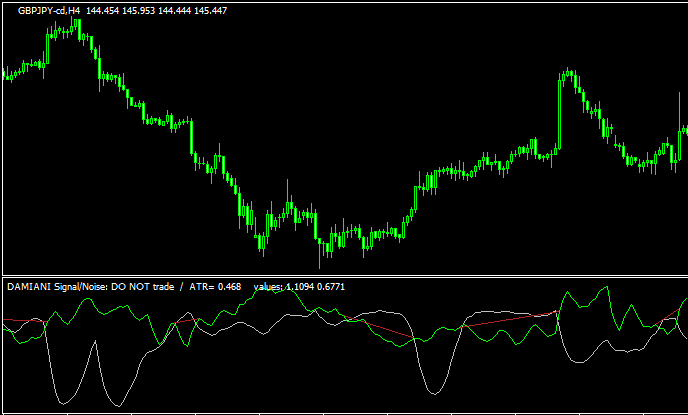
ノイズフィルターとして使える「signal_to_noise」
 オシレーター
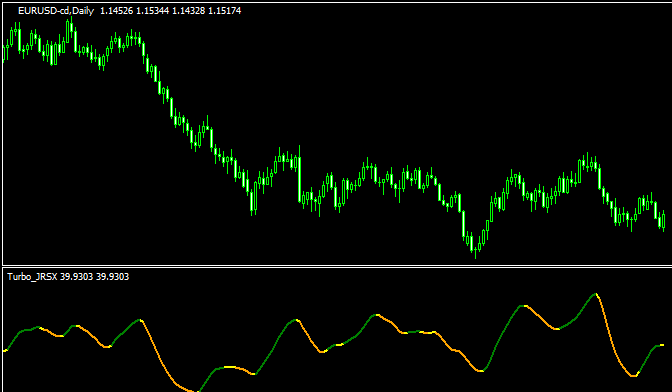
向きで色の変わるオシレーター「3c_turbo_jrsx_filtered」
 オシレーター
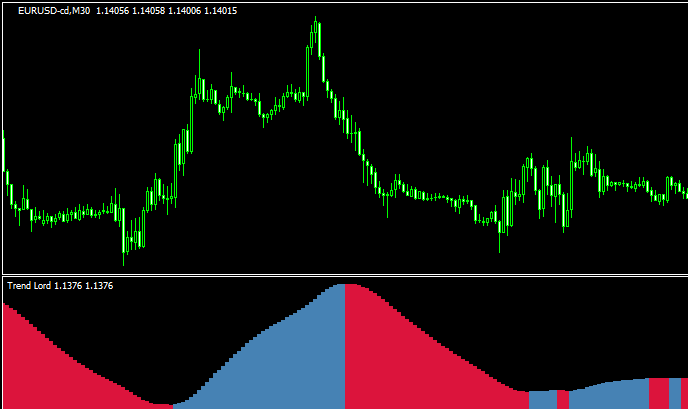
ダイナミックにトレンド方向を示す「TrendLord」
勝てる手法10個+超凄いインジをプレゼント!

\初心者から上級者まで大注目!/
当サイト限定で、XMの口座開設をすると「Forex Standard Club XM版」へ無料招待!
✔️ 期間限定で13,000円のボーナス!
✔️ 最大500ドルまで100%入金ボーナス!
✔️ 勝率を上げるトレード手法&限定インジケーターを多数提供!
将来の動きを予測する無料ツール差し上げます

未来予測インジケーター「Futuro FX」は、過去の動きと現在の動きの相関から少し先の動きを予測します。メルマガ登録で詳しい解説書をプレゼント!
さらにスマートマネーコンセプト(SMC)について解説したPDFもプレゼント!
\初心者から上級者まで大注目!/
当サイト限定で、XMの口座開設をすると「Forex Standard Club XM版」へ無料招待!
✔️ 13,000円のボーナス!
✔️ 最大1000ドルまで100%入金ボーナス!
✔️ 勝率を上げるトレード手法&限定インジケーターを多数提供!