
 オシレーター
オシレーター
オシレーター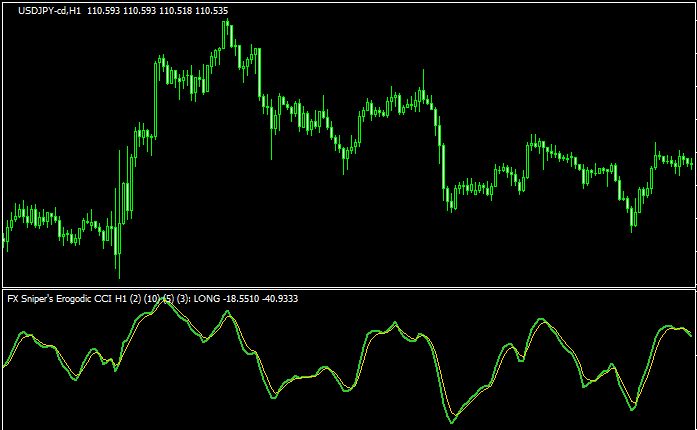 オシレーター
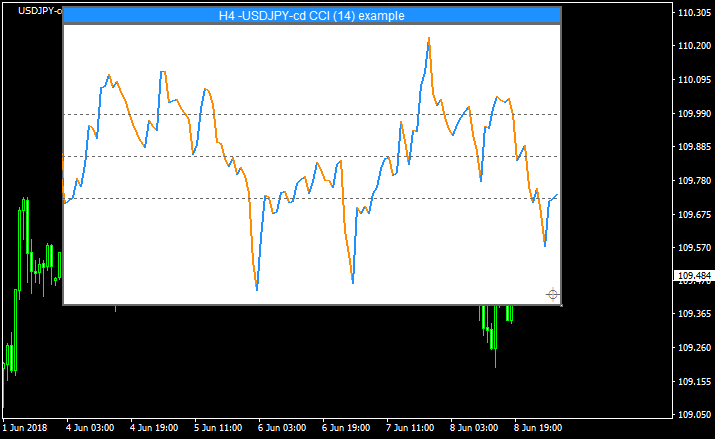
CCIの改良版「FX Sniper’s Ergodic CCI Trigger」
 オシレーター
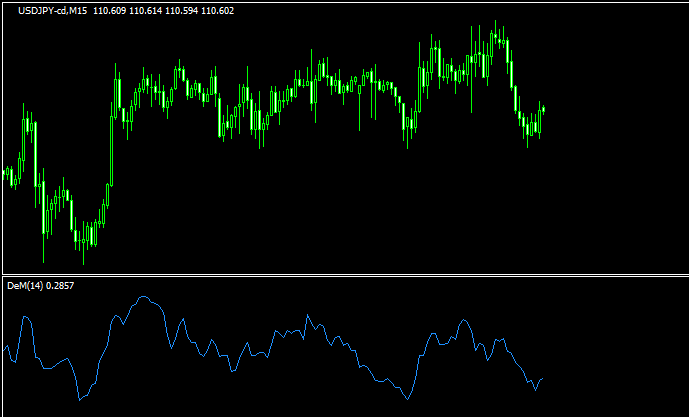
クラシカルながらも根強い人気のオシレーター「DeMarker」
 オシレーター
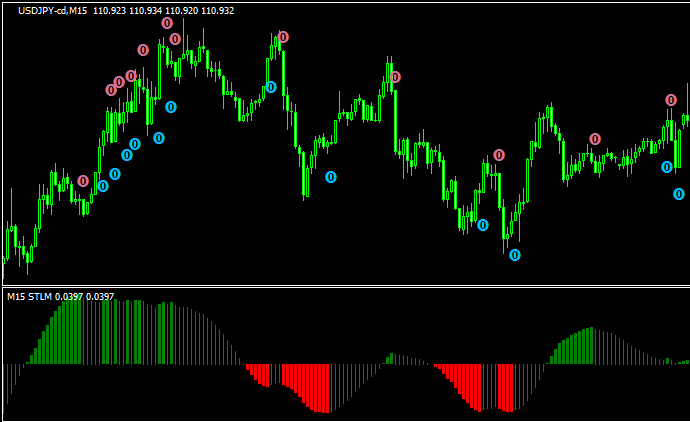
ヒストグラムをベースにシグナルの出る「STLM_hist + alerts + arrows on chart mtf」
 オシレーター
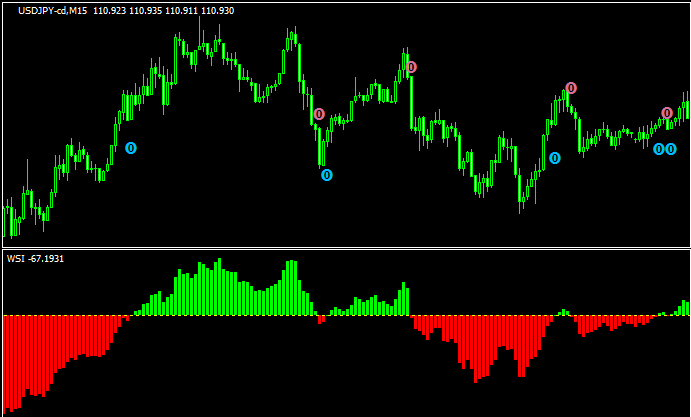
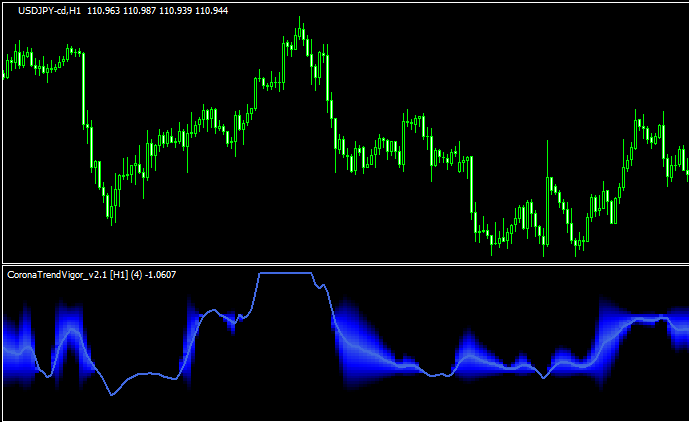
燃えるようなオシレーター「CoronaTrendVigor _v2.1」
 オシレーター
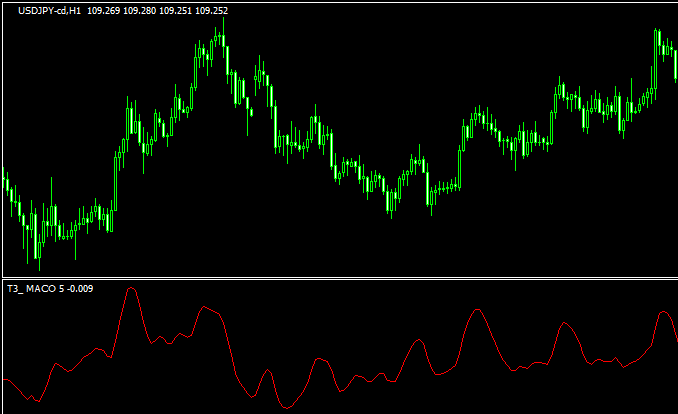
ダイバージェンスが面白い?「T3 MACO」
 オシレーター
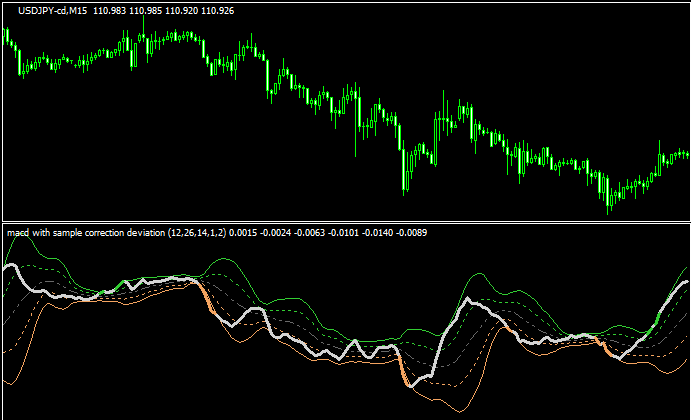
MACDとボリバンの夢の共演!「macd with standard deviations」
 オシレーター
ラインがクロスしたらドットが点灯するオシレーター「ForecastOscillator」
 オシレーター
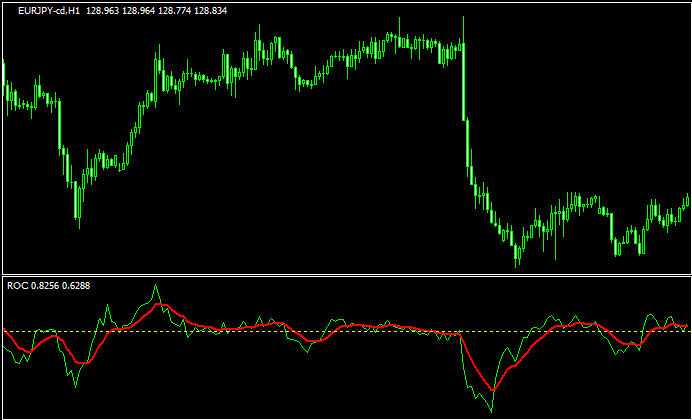
ROCとMAを一緒に表示する「ROC_with_Signal_MA」
 オシレーター
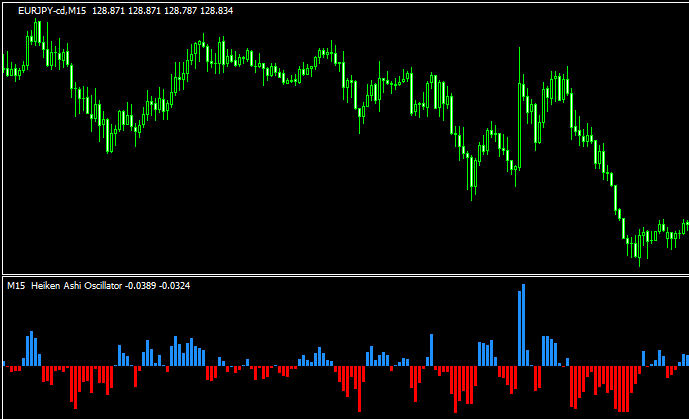
サブウィンドウに平均足をベースとしたオシレーターを表示する「heiken ashi oscillator mtf alerts」
 オシレーター
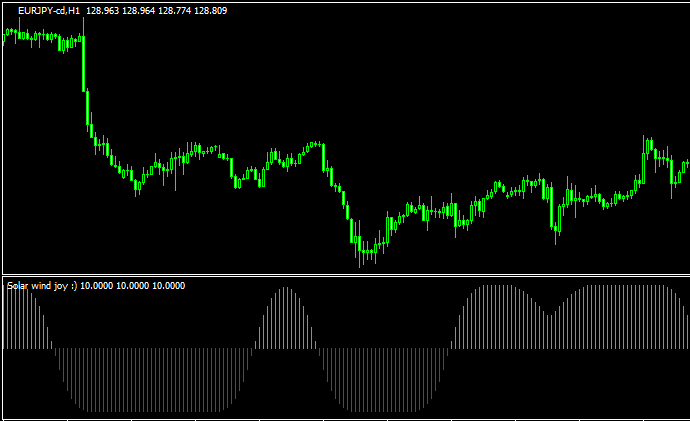
丸くてなめらかなヒストグラム「Solar Winds joy – histo」
 オシレーター
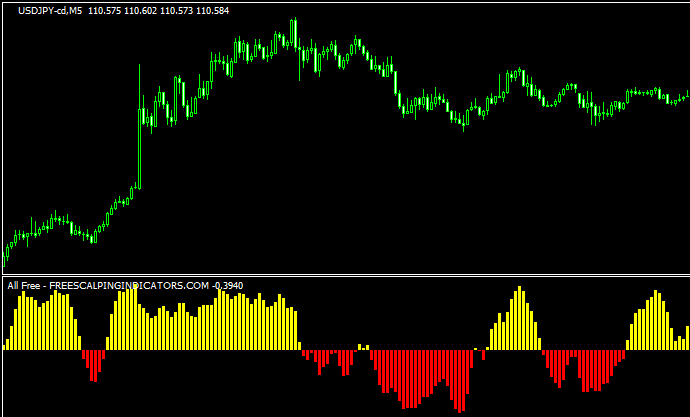
スキャルピング専用インジ「freescalpingindicator」
 オシレーター
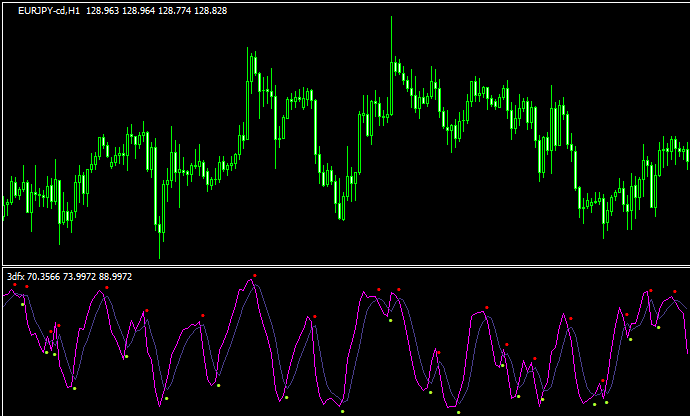
クロスしたらドットが点灯するオシレーター「3dfx」
 オシレーター
メインチャート上にオシレーターを表示する「Floating indicator」
 オシレーター
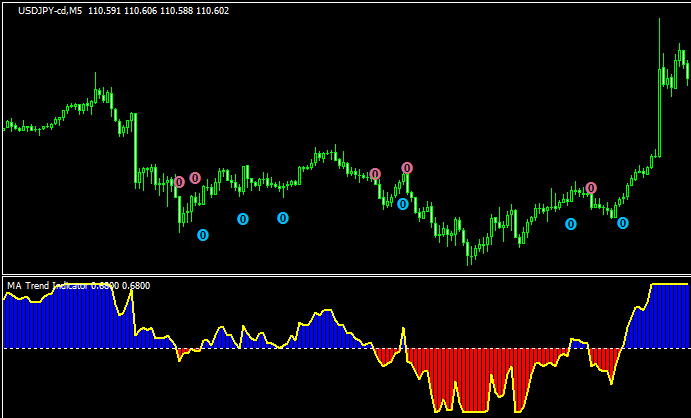
【リペイント無し】MAをベースにシグナルが出る「MA_Trend_Indicator alerts + arrows」
 オシレーター
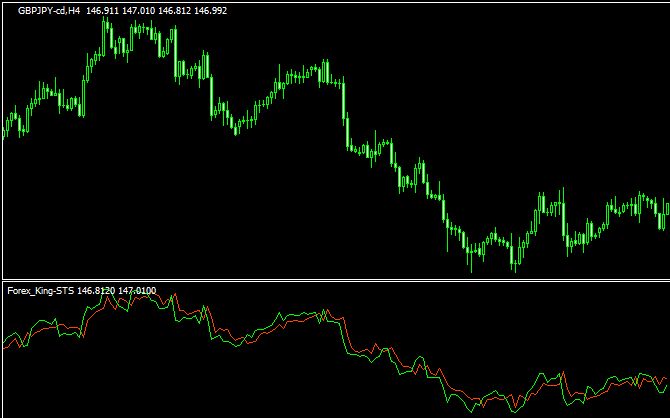
トレンドフォローの短期売買向けのインジ「Forex_King-STS」
勝てる手法10個+超凄いインジをプレゼント!

\初心者から上級者まで大注目!/
当サイト限定で、XMの口座開設をすると「Forex Standard Club XM版」へ無料招待!
✔️ 期間限定で13,000円のボーナス!
✔️ 最大500ドルまで100%入金ボーナス!
✔️ 勝率を上げるトレード手法&限定インジケーターを多数提供!
将来の動きを予測する無料ツール差し上げます

未来予測インジケーター「Futuro FX」は、過去の動きと現在の動きの相関から少し先の動きを予測します。メルマガ登録で詳しい解説書をプレゼント!
さらにスマートマネーコンセプト(SMC)について解説したPDFもプレゼント!
\初心者から上級者まで大注目!/
当サイト限定で、XMの口座開設をすると「Forex Standard Club XM版」へ無料招待!
✔️ 13,000円のボーナス!
✔️ 最大1000ドルまで100%入金ボーナス!
✔️ 勝率を上げるトレード手法&限定インジケーターを多数提供!