
 バータイプ
バータイプバータイプ
バータイプ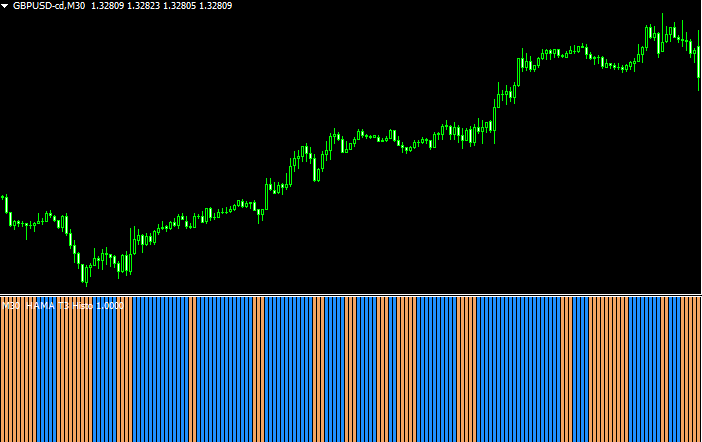 バータイプ
バータイプ平均足スムーズドをバーで表示する「Heiken_Ashi_Smoothed_Alert」
 バータイプ
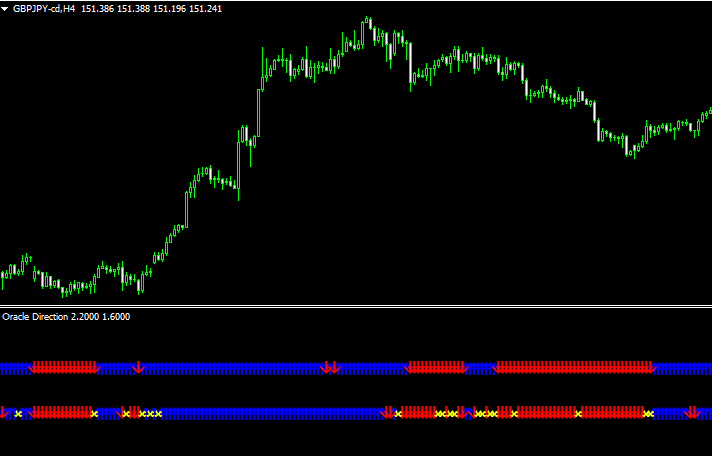
バータイプ相場の方向を連続した矢印で示す「oracle-direction」
 バータイプ
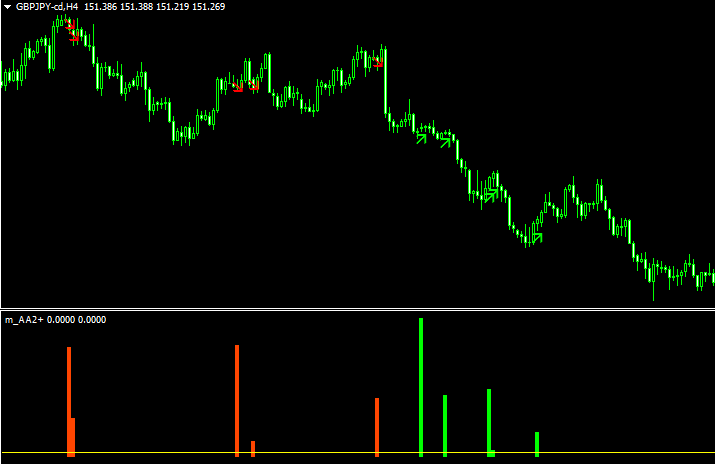
バータイプ精度は悪くないが、リペイントするシグナル「aa-indicator」
 バータイプ
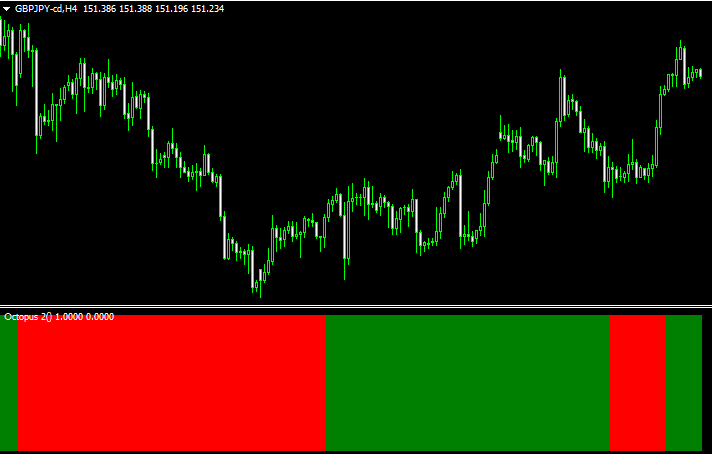
バータイプ相場の方向を色で表示「octopus」
 バータイプ
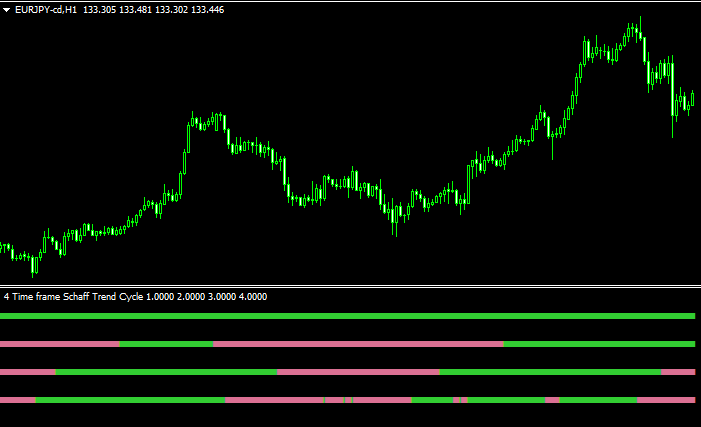
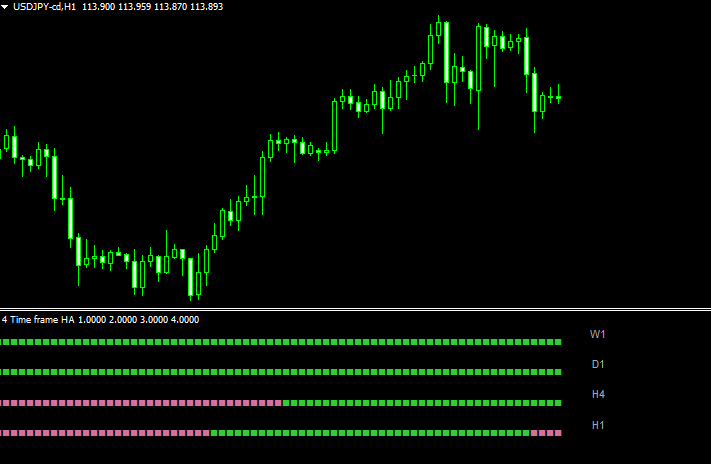
バータイプ4つの時間軸で平均足スムーズドを示す「4 time frame heiken ashi smothed + alerts nmc」
 バータイプ
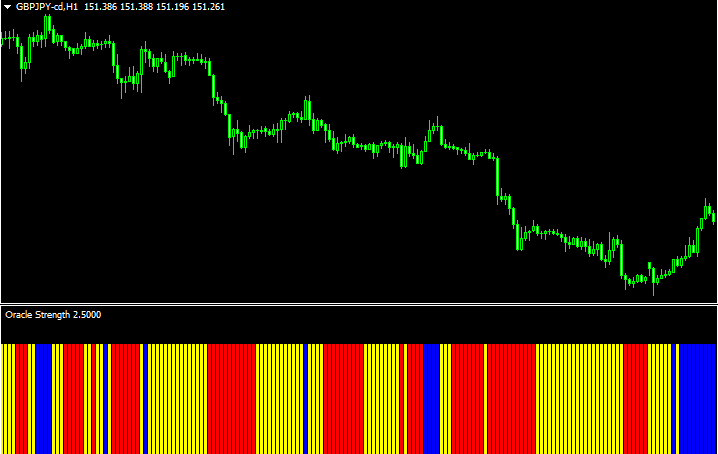
バータイプ相場の上げ、下げ、レンジを判断する「oracle-strength-indicator」
 バータイプ
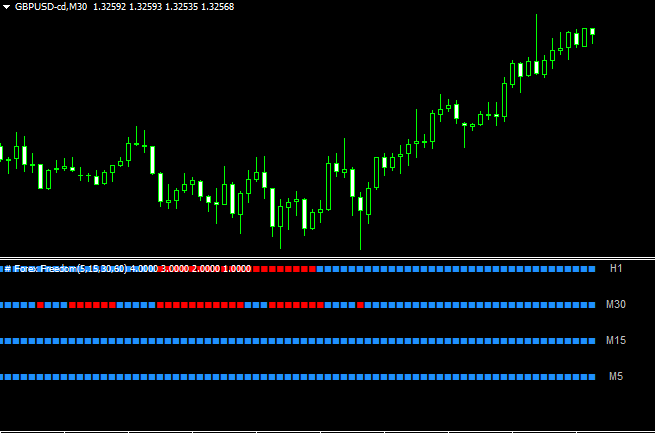
バータイプCCIのマルチタイムフレーム「mtf forex freedom bar v2_60m_hercs」
 バータイプ
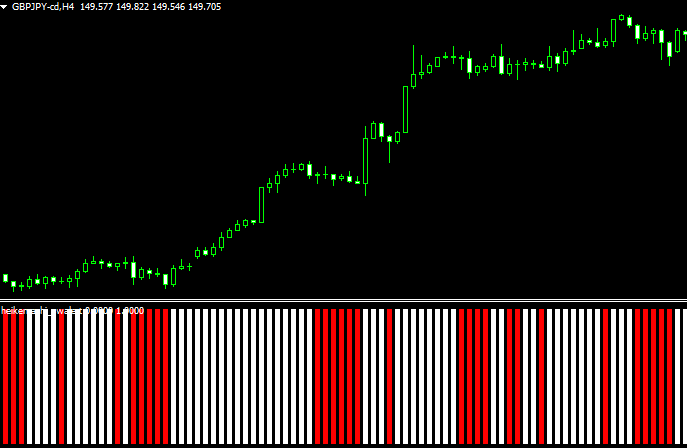
バータイプ平均足の状況をバーで表示する「heiken ashi_swalert」
 バータイプ
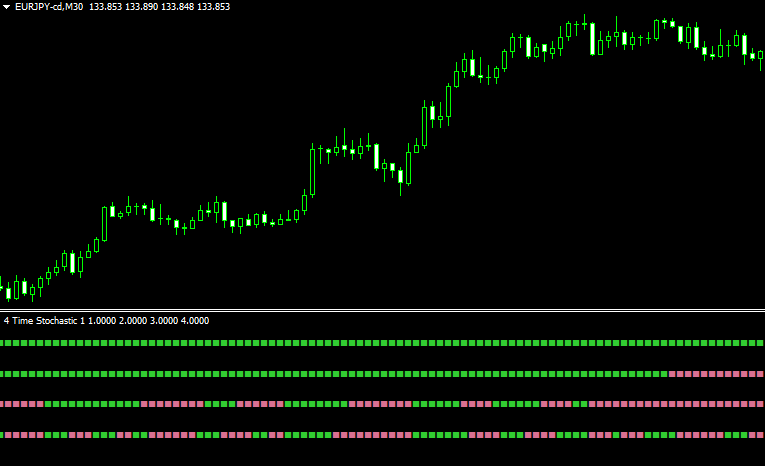
バータイプ4つの時間枠でストキャスティクスが見れる「4 time frame stochastic 2」
 バータイプ
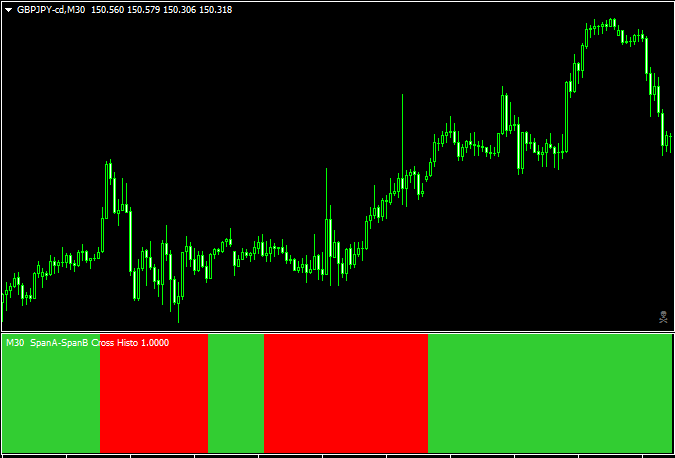
バータイプ一目均衡表の雲のねじれを示すインジ「SpanA – SpanB cross Histo nmc 2」
 バータイプ
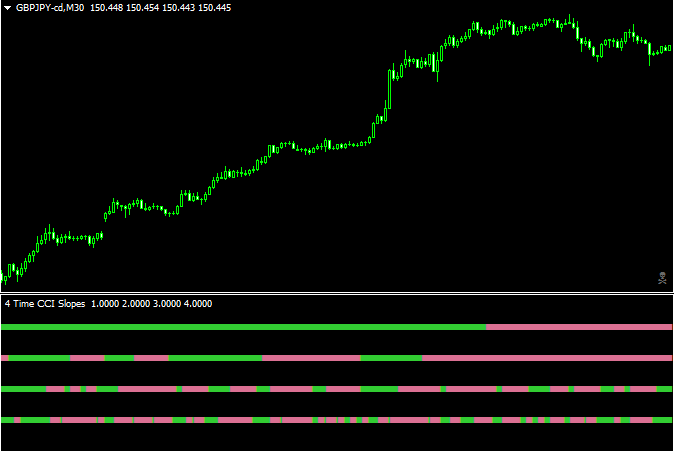
バータイプCCIを4つの時間軸で監視できる「4 time frame CCI slope nmc」
 バータイプ
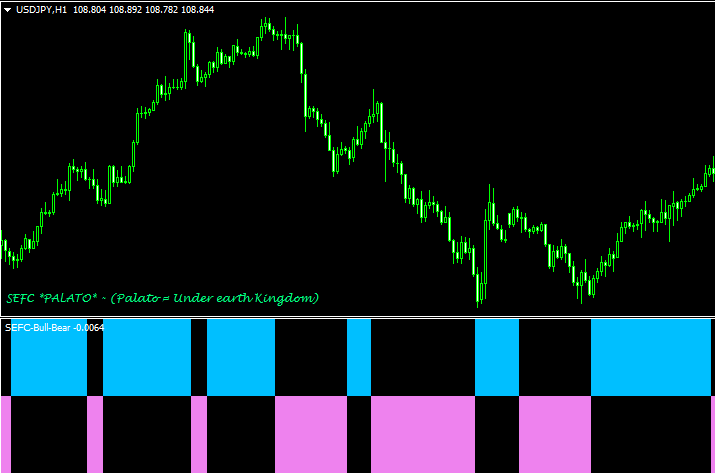
バータイプ相場が上向きか下向きかが分かる「sefc bulls-bears」
 バータイプ
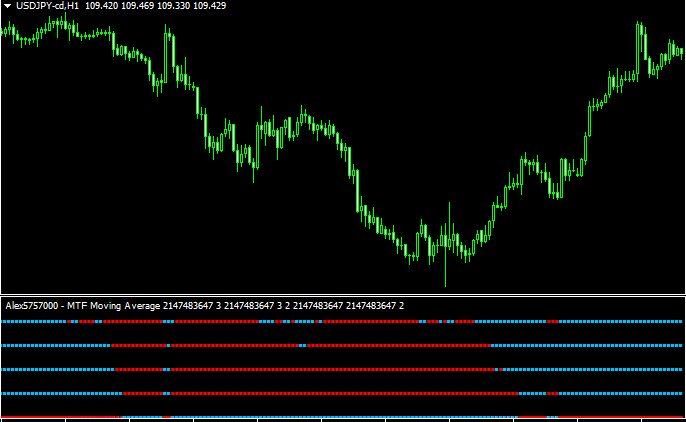
バータイプ複数の移動平均線が上向きか下向きか一目で分かる「Alex5757000_-_Multi_Moving_Average」
 バータイプ
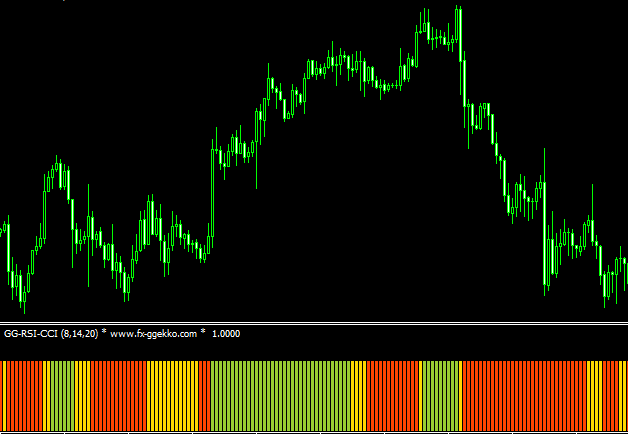
バータイプRSIとCCIでトレンドを判別する「GG-RSI-CCI」
 バータイプ
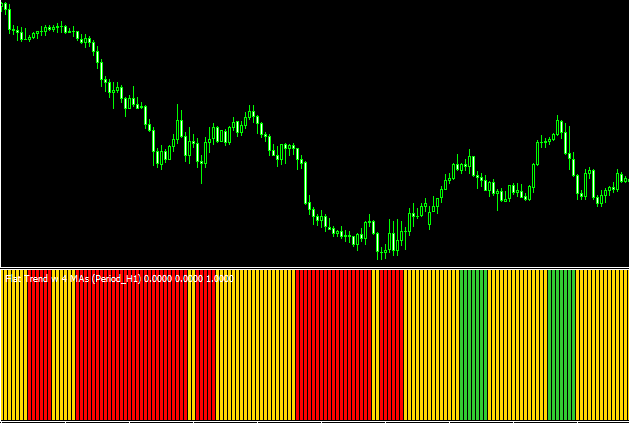
バータイプ4つの移動平均線から相場のトレンドを判別する「4MAs Trend」
勝てる手法10個+超凄いインジをプレゼント!

\初心者から上級者まで大注目!/
当サイト限定で、XMの口座開設をすると「Forex Standard Club XM版」へ無料招待!
✔️ 期間限定で13,000円のボーナス!
✔️ 最大500ドルまで100%入金ボーナス!
✔️ 勝率を上げるトレード手法&限定インジケーターを多数提供!
将来の動きを予測する無料ツール差し上げます

未来予測インジケーター「Futuro FX」は、過去の動きと現在の動きの相関から少し先の動きを予測します。メルマガ登録で詳しい解説書をプレゼント!
さらにスマートマネーコンセプト(SMC)について解説したPDFもプレゼント!
\初心者から上級者まで大注目!/
当サイト限定で、XMの口座開設をすると「Forex Standard Club XM版」へ無料招待!
✔️ 13,000円のボーナス!
✔️ 最大1000ドルまで100%入金ボーナス!
✔️ 勝率を上げるトレード手法&限定インジケーターを多数提供!