
 バータイプ
バータイプバータイプ
バータイプ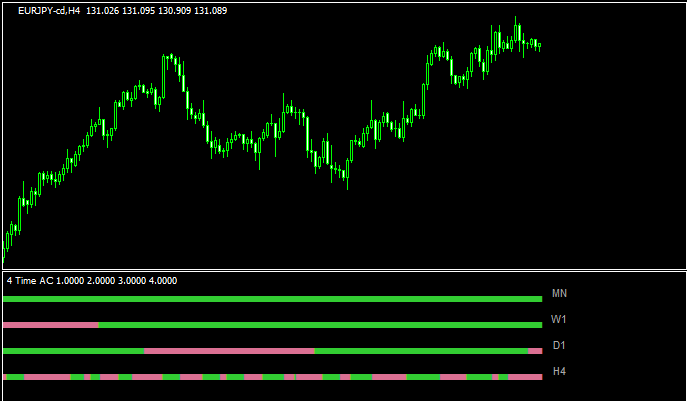 バータイプ
バータイプマルチタイムでAccelerator Oscillatorを示す「4 time frame AC slope nmc」
 バータイプ
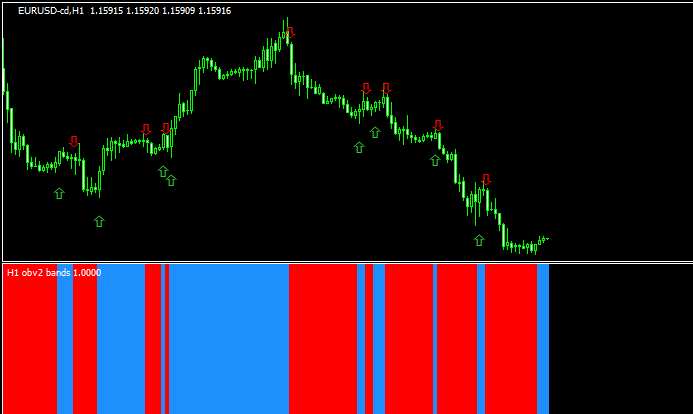
バータイプ【リペイント無し】OBVを利用したシグナルインジ「obv ma histo mtf arrows + alerts」
 バータイプ
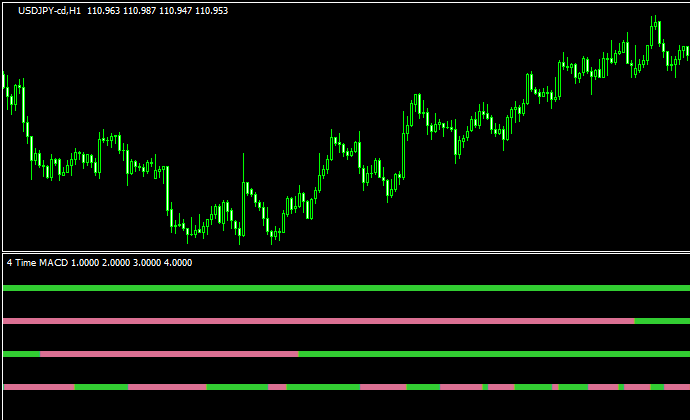
バータイプ4つの時間軸のMACDを表示する「4 time frame MACD nmc」
 バータイプ
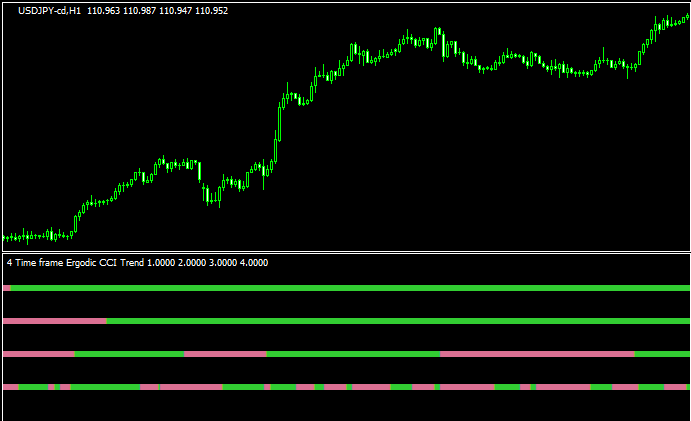
バータイプ4つの時間軸でErgodic CCIを表示させる「4 time frame Ergodic CCI」
 バータイプ
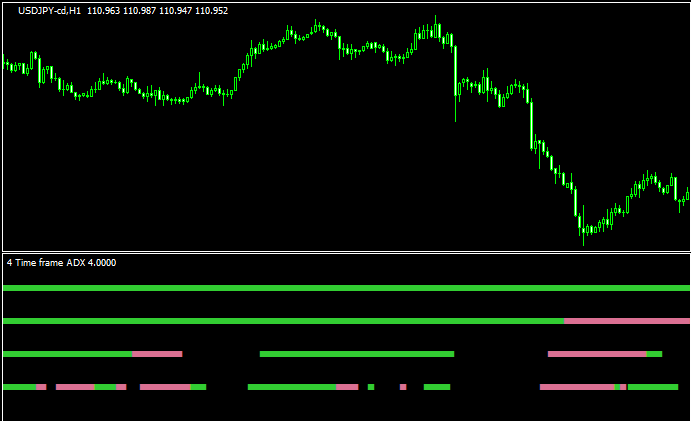
バータイプ4つの時間軸でADXを監視できる「4 time frame ADX nmc」
 バータイプ
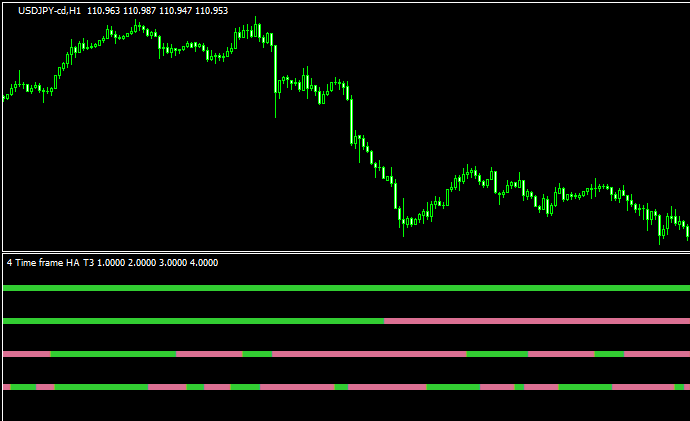
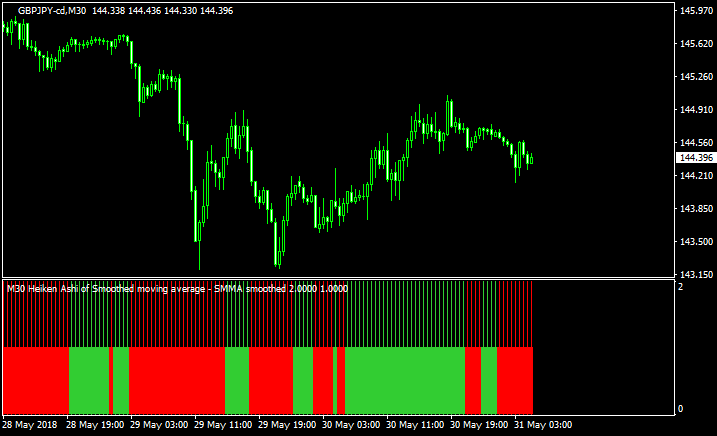
バータイプ平均足T3スムーズドの状況をマルチタイムで表示する「4 time frame heiken ashi T3 smothed nmc」
 バータイプ
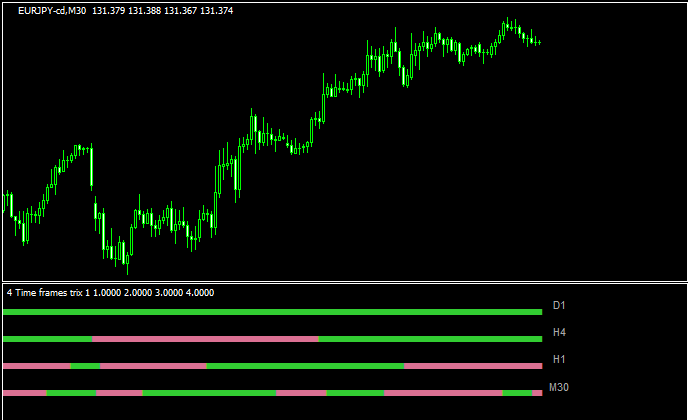
バータイプ4つの時間軸でTrixを示す「 4 time frame trix nmc」
 バータイプ
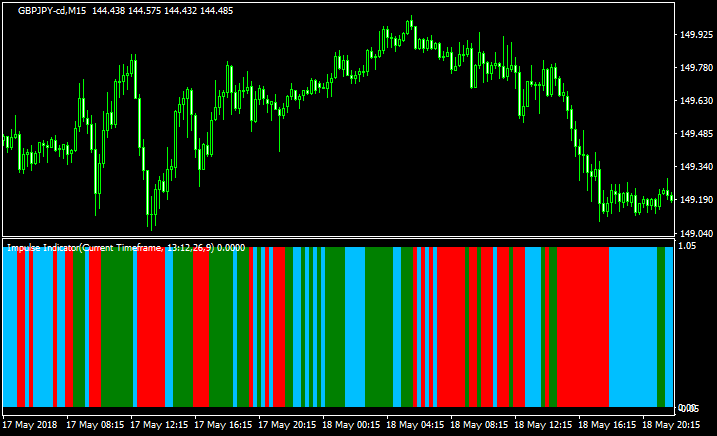
バータイプ相場がトレンドかレンジかを示す「impulse-indicator」
 バータイプ
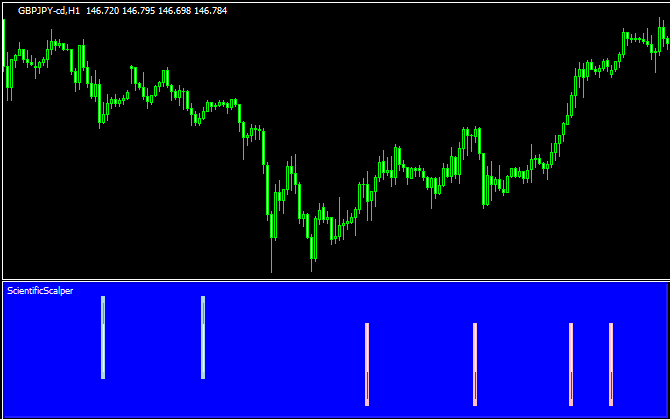
バータイプ【リペイント無し】スキャルピング用のシグナルインジ「ScientificScalper」
 バータイプ
バータイプ平均足MAをバーとして表示する「heiken ashi averages histo」
 バータイプ
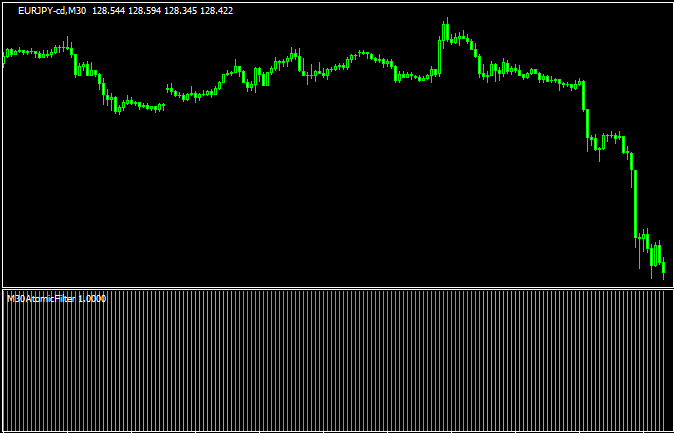
バータイプトレンドをバーの色で示す「atomicdos」
 バータイプ
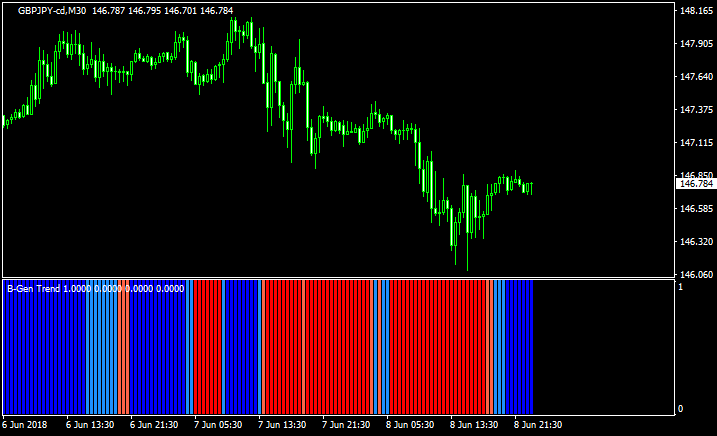
バータイプ4種類の色でトレンドの強弱を示す「B-Gen Trend」
 バータイプ
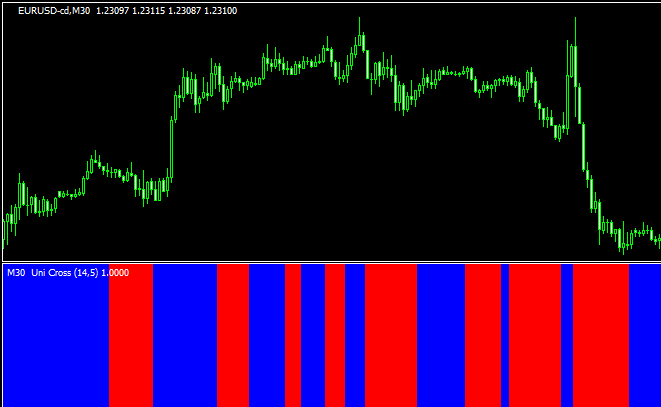
バータイプT3を利用してトレンド方向を示す「uni_cross_histo_nmc_alerts__shift」
 バータイプ
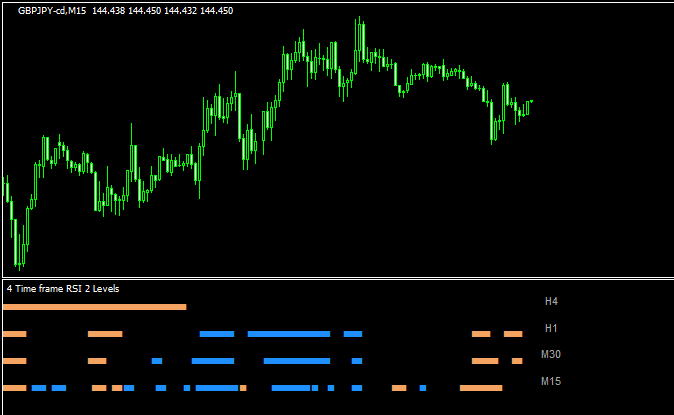
バータイプマルチタイムでRSIを分かりやすく表示する「4 time frame rsi 2.1 Levels nmc」
 バータイプ
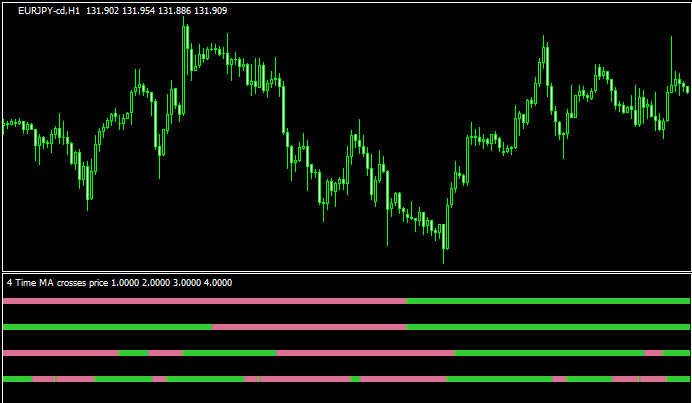
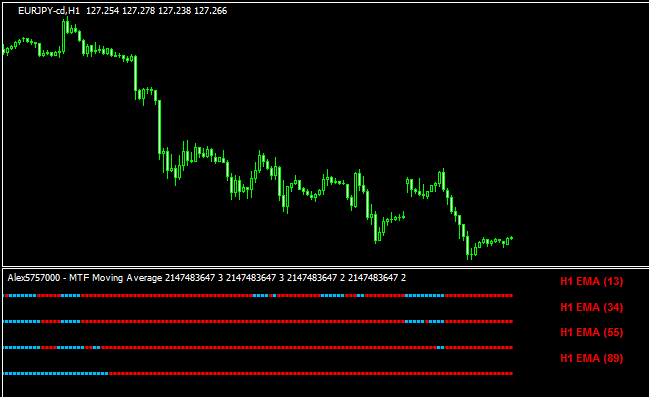
バータイプ複数のMAとローソク足の位置関係をバーで表示する「Multi Moving Average」
勝てる手法10個+超凄いインジをプレゼント!

\初心者から上級者まで大注目!/
当サイト限定で、XMの口座開設をすると「Forex Standard Club XM版」へ無料招待!
✔️ 期間限定で13,000円のボーナス!
✔️ 最大500ドルまで100%入金ボーナス!
✔️ 勝率を上げるトレード手法&限定インジケーターを多数提供!
将来の動きを予測する無料ツール差し上げます

未来予測インジケーター「Futuro FX」は、過去の動きと現在の動きの相関から少し先の動きを予測します。メルマガ登録で詳しい解説書をプレゼント!
さらにスマートマネーコンセプト(SMC)について解説したPDFもプレゼント!
\初心者から上級者まで大注目!/
当サイト限定で、XMの口座開設をすると「Forex Standard Club XM版」へ無料招待!
✔️ 13,000円のボーナス!
✔️ 最大1000ドルまで100%入金ボーナス!
✔️ 勝率を上げるトレード手法&限定インジケーターを多数提供!