
 相場状況表示
相場状況表示
相場状況表示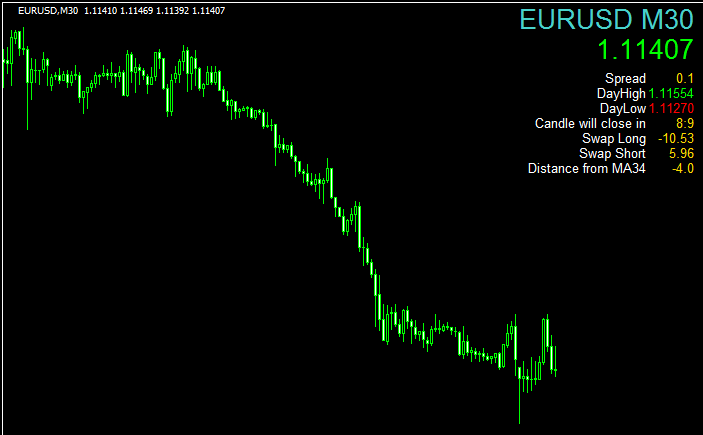 相場状況表示
現在の状況を表示する「milanese-market-info-indicator」
 相場状況表示
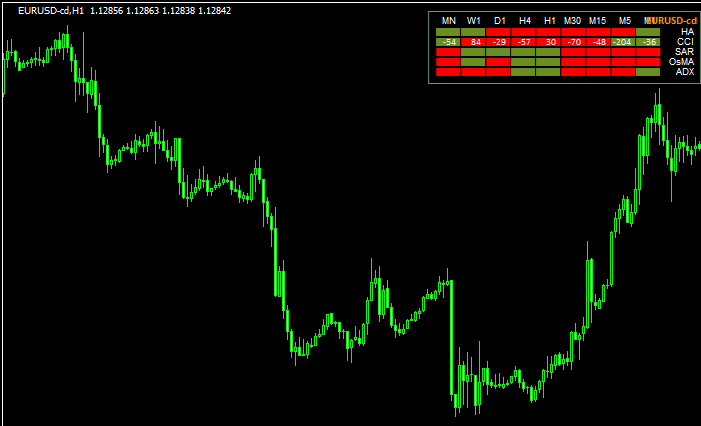
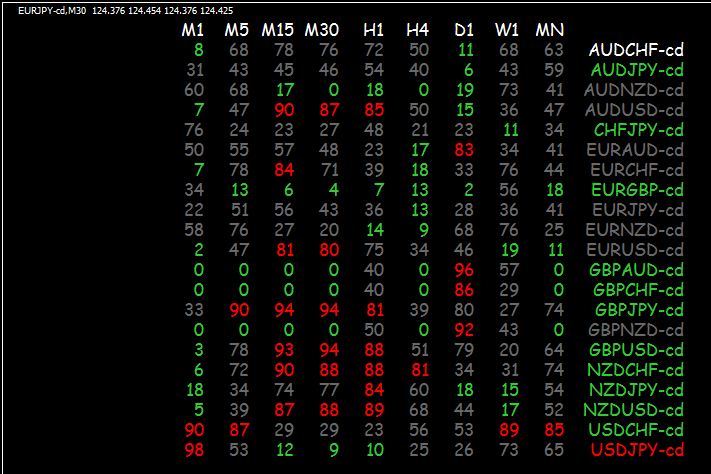
マルチタイムで複数の指標の状況を示す「MTF DashBoard Indicators」
 相場状況表示
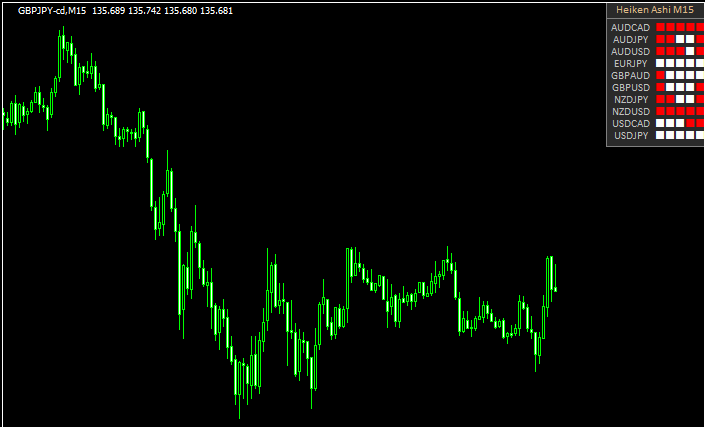
複数の通貨ペアの平均足の状況を示す「Dashboard Heiken Ashi」
 相場状況表示
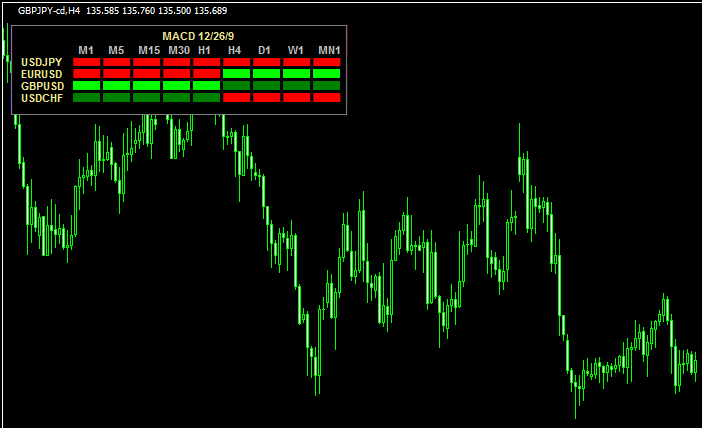
マルチタイム&マルチ通貨ペアでトレンド状況を把握する「MACD OsMA Multi Pair Dashboard v1.1」
 相場状況表示
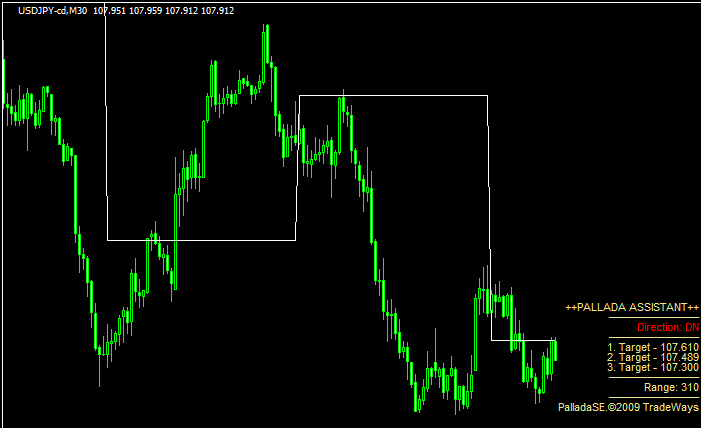
現在のトレンド方向やターゲットのレートを示す「 Pallada_Assistant」
 相場状況表示
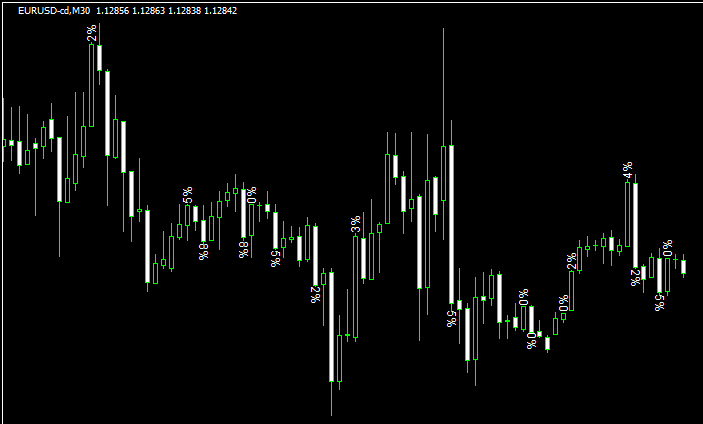
ローソク足のヒゲの長さの割合が示される「Wick Label 2.0」
 相場状況表示
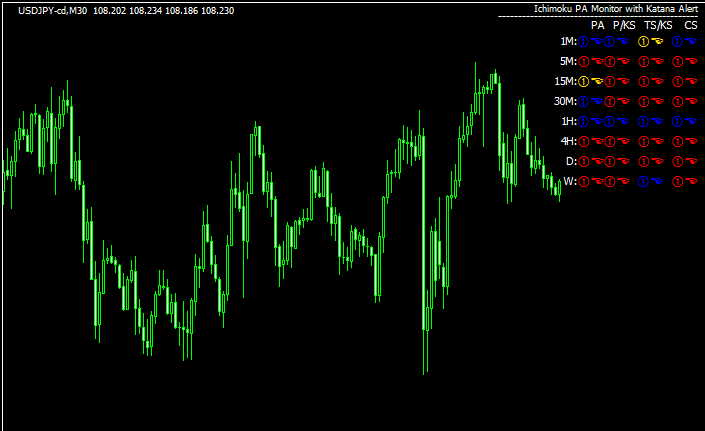
マルチタイムで一目均衡表の状況が確認できる「Ichimoku_Monitor」
 相場状況表示
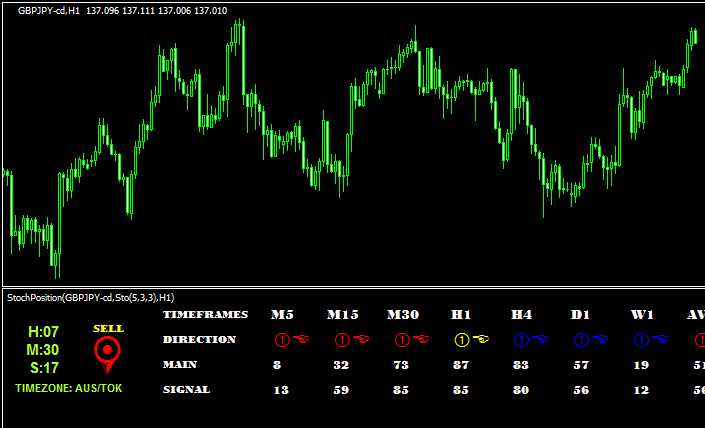
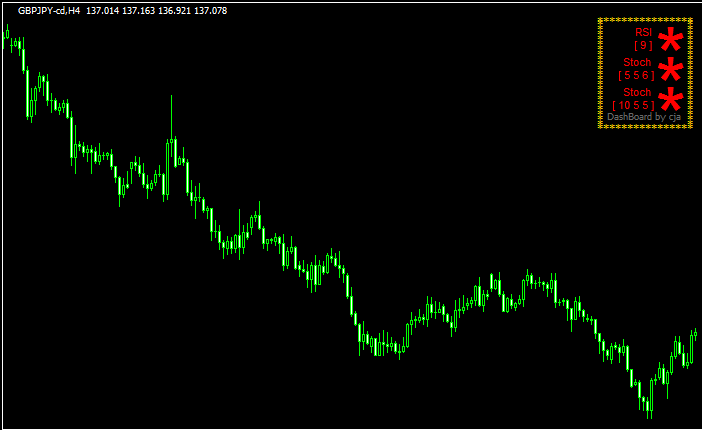
RSIやストキャスティクスの状況を示す「DashBoard」
 相場状況表示
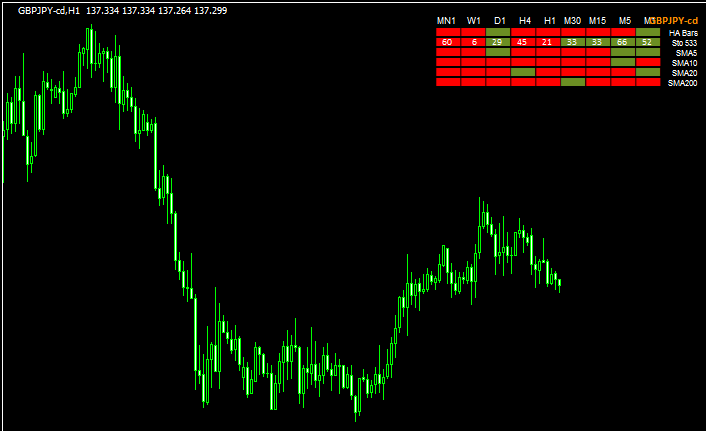
マルチタイムで様々なインジの情報を示す「MTF DashBoard v3」
 相場状況表示
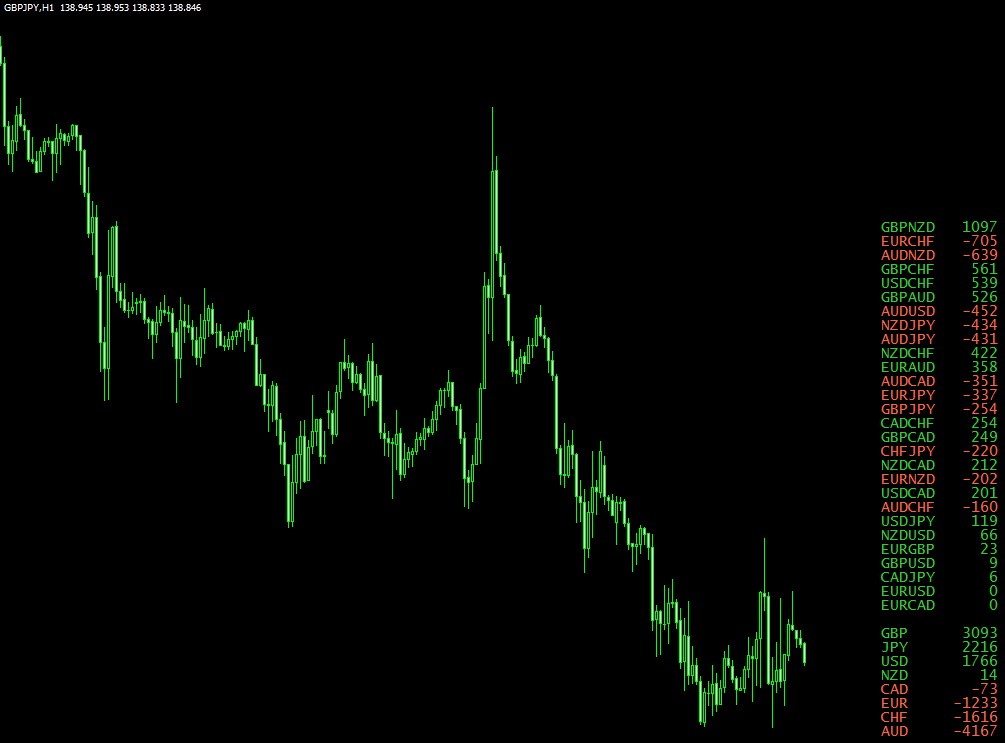
通貨や通貨ペアの強弱を示す「Pair Strength Analyst」
 相場状況表示
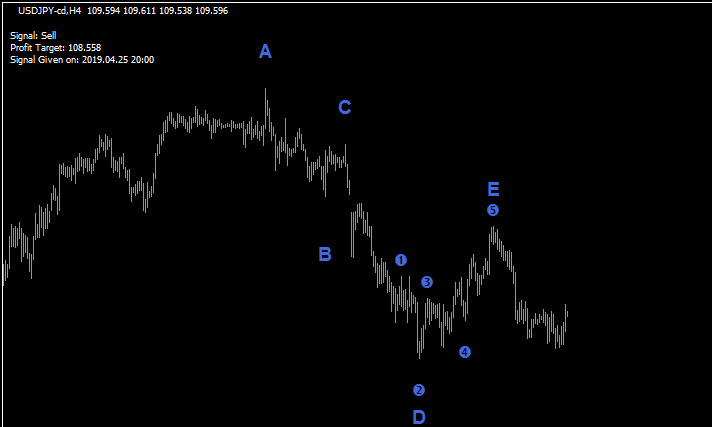
エリオット波動を認識する「EWPro」
 相場状況表示
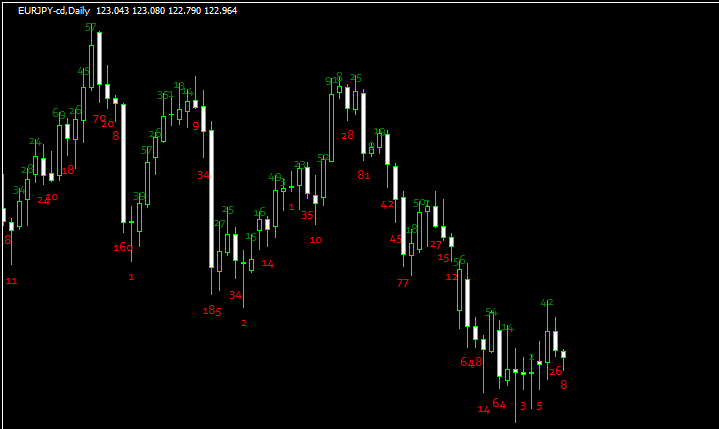
始値から終値までの値幅を示す「Candle Open Close Pips」
 相場状況表示
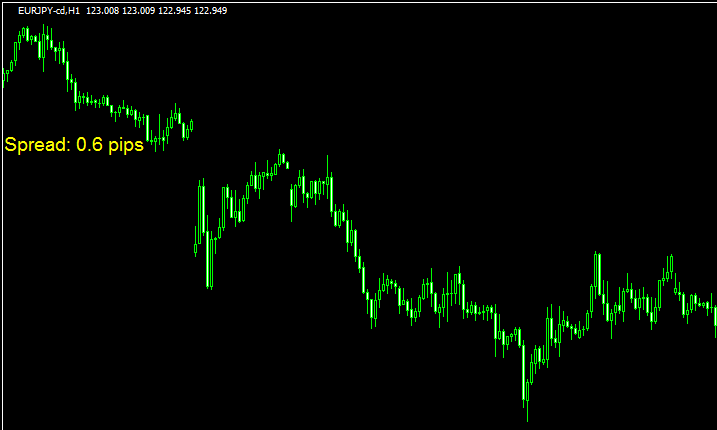
スプレッド見やすく表示する「Spread_5digit」
 相場状況表示
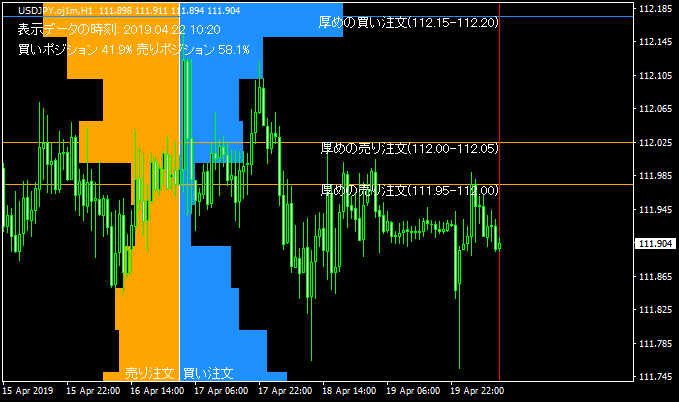
市場参加者のポジションや注文状況が丸わかり「Oanda Orderbook2」
 相場状況表示
ストキャスティクスの状態を一覧で示す「Stochastic Dashboard」
勝てる手法10個+超凄いインジをプレゼント!

\初心者から上級者まで大注目!/
当サイト限定で、XMの口座開設をすると「Forex Standard Club XM版」へ無料招待!
✔️ 期間限定で13,000円のボーナス!
✔️ 最大500ドルまで100%入金ボーナス!
✔️ 勝率を上げるトレード手法&限定インジケーターを多数提供!
将来の動きを予測する無料ツール差し上げます

未来予測インジケーター「Futuro FX」は、過去の動きと現在の動きの相関から少し先の動きを予測します。メルマガ登録で詳しい解説書をプレゼント!
さらにスマートマネーコンセプト(SMC)について解説したPDFもプレゼント!
\初心者から上級者まで大注目!/
当サイト限定で、XMの口座開設をすると「Forex Standard Club XM版」へ無料招待!
✔️ 13,000円のボーナス!
✔️ 最大1000ドルまで100%入金ボーナス!
✔️ 勝率を上げるトレード手法&限定インジケーターを多数提供!