
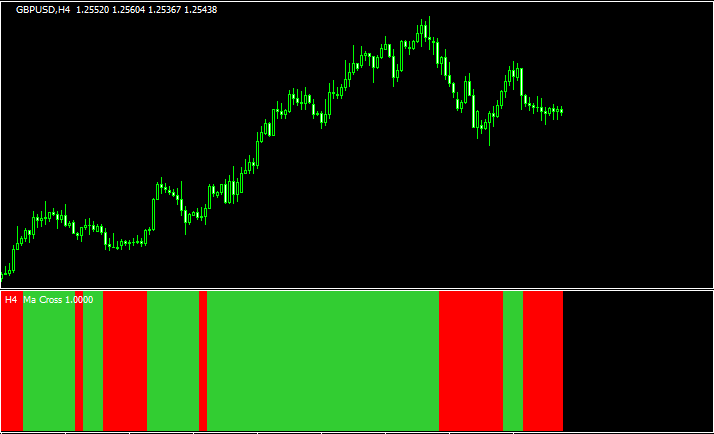
 バータイプ
バータイプサブチャート
バータイプ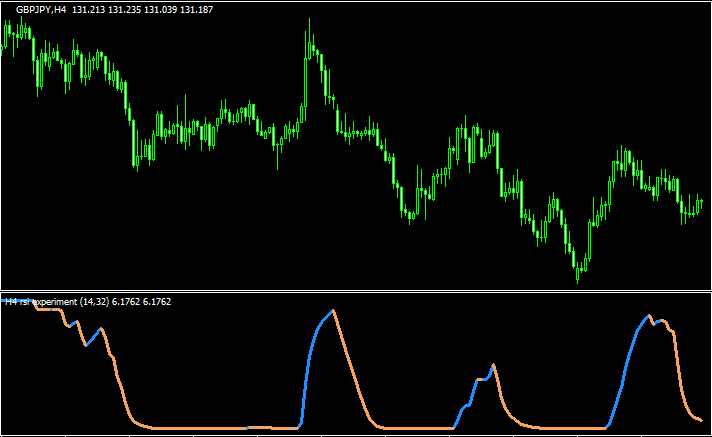 オシレーター
RSIを平滑化した「rsi_experiment_extended」
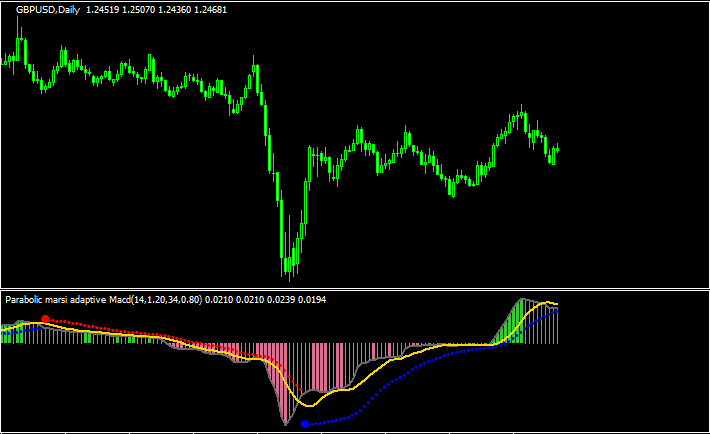 オシレーター
パラボリックを魔改造した「Parabolic marsi adaptive MACD」
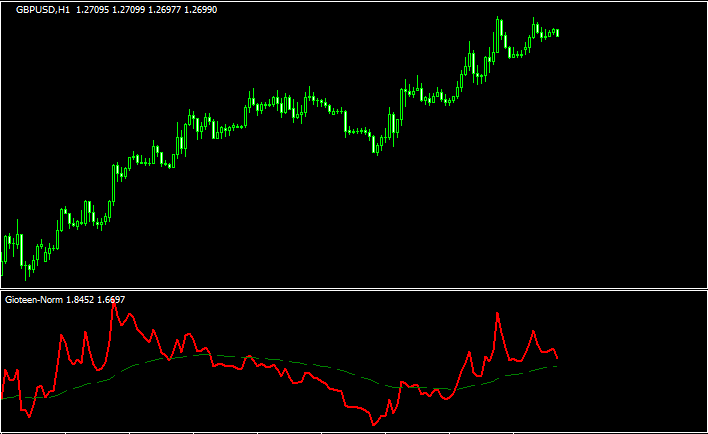 バータイプ
バータイプ価格の勢いに反応する「Gioteen-Norm」
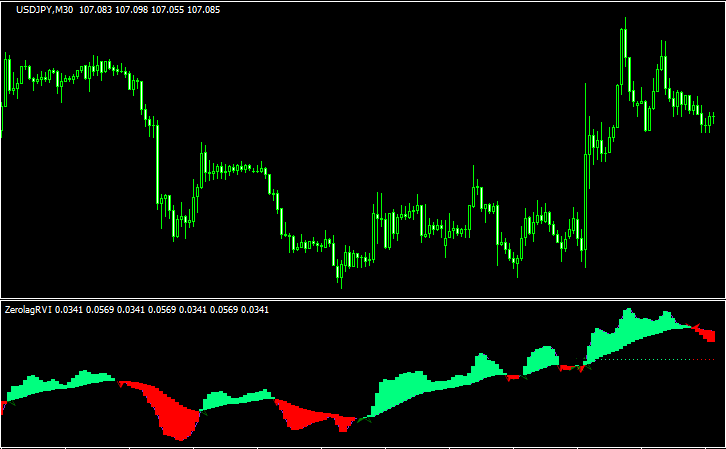 オシレーター
RVIをベースとした「colorzerolagrvi」
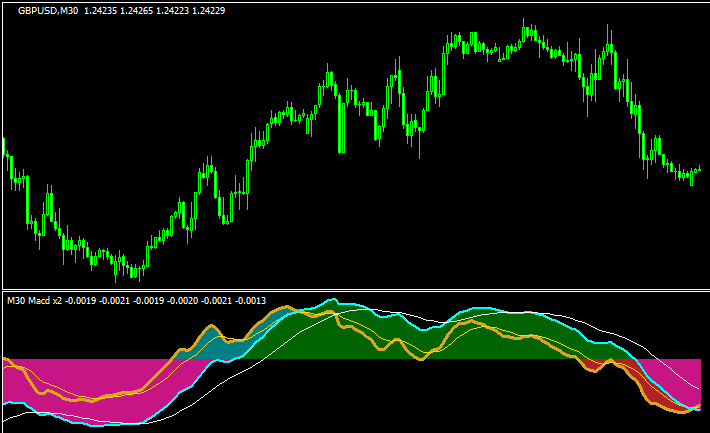 オシレーター
2つのMACDを重ねて表示する「macd x 2.01 mtf」
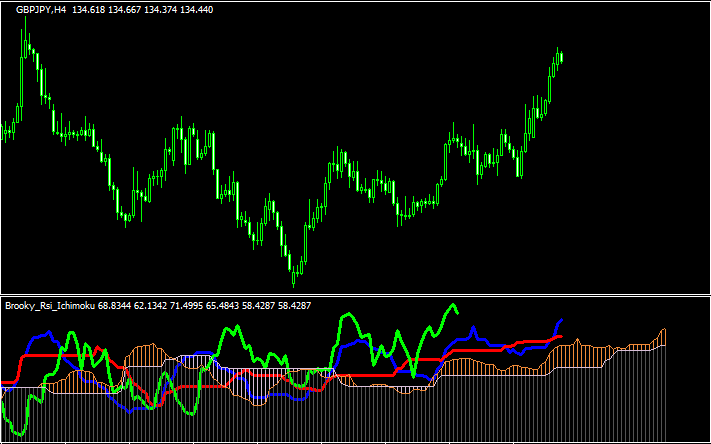 オシレーター
RSIに一目均衡表を適用させた「Brooky_Rsi_Ichimoku」
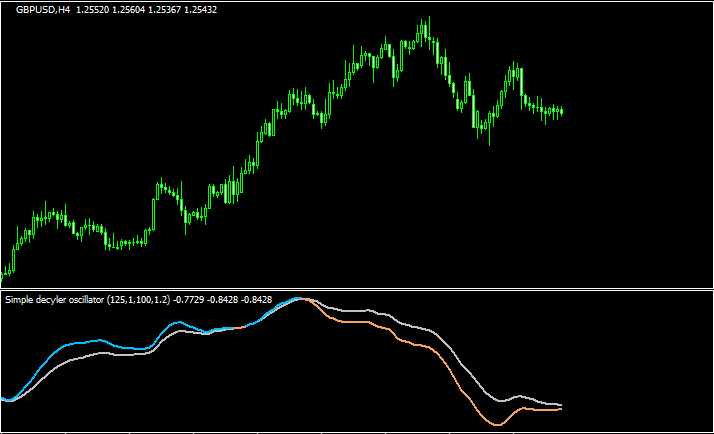 オシレーター
不思議な動きをするオシレーター「Simple Decycler Oscillator」
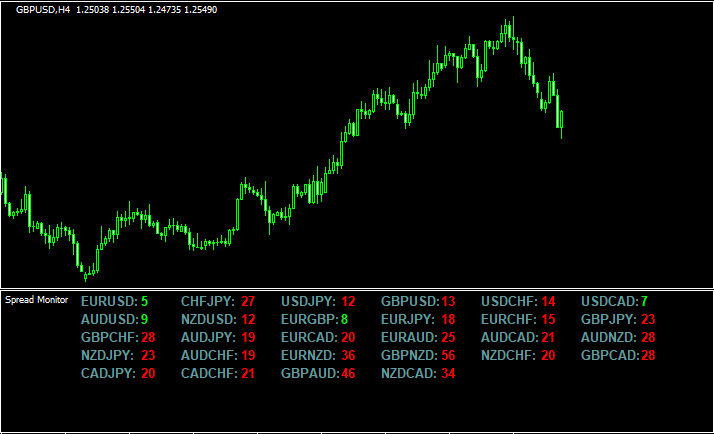 相場状況表示
チャート下にスプレッドを一覧で表示する「Multi Pair Spread Monitor」
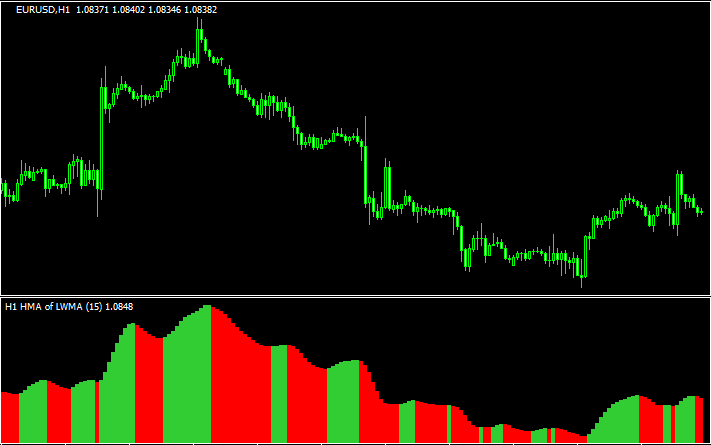 オシレーター
HMAをベースとしたヒストグラム「Hma averages – histo (mtf + alerts + lines)」
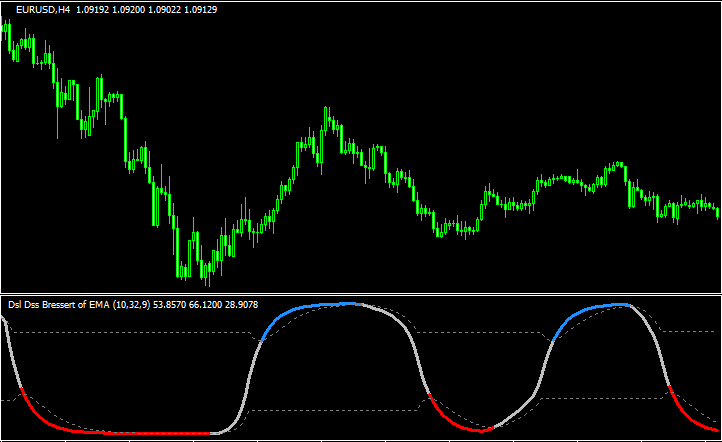 オシレーター
ストキャスをベースとしたトレドフォロー型のオシレーター「dsl dss averages (alerts + arrows)」
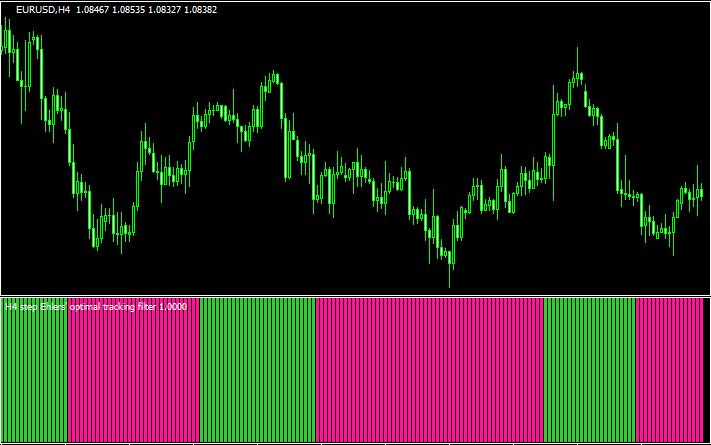 バータイプ
バータイプチャート下にトレンド方向を示す「step ehlers optimal tracking filter histo (mtf + alerts)」
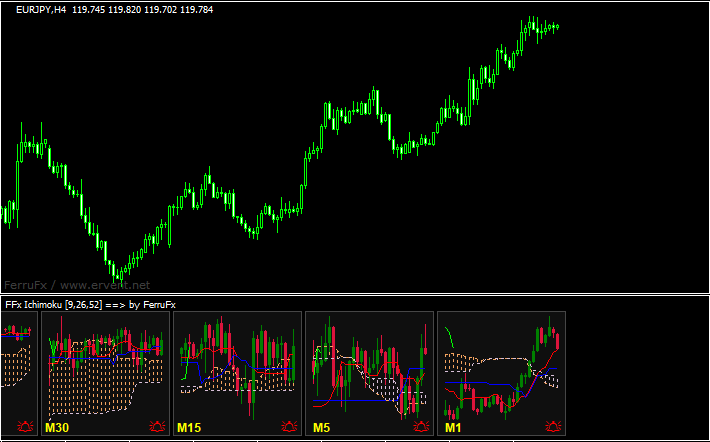 相場状況表示
マルチタイムで一目均衡表を表示する「FFx_IchimokuKinkoHyo」
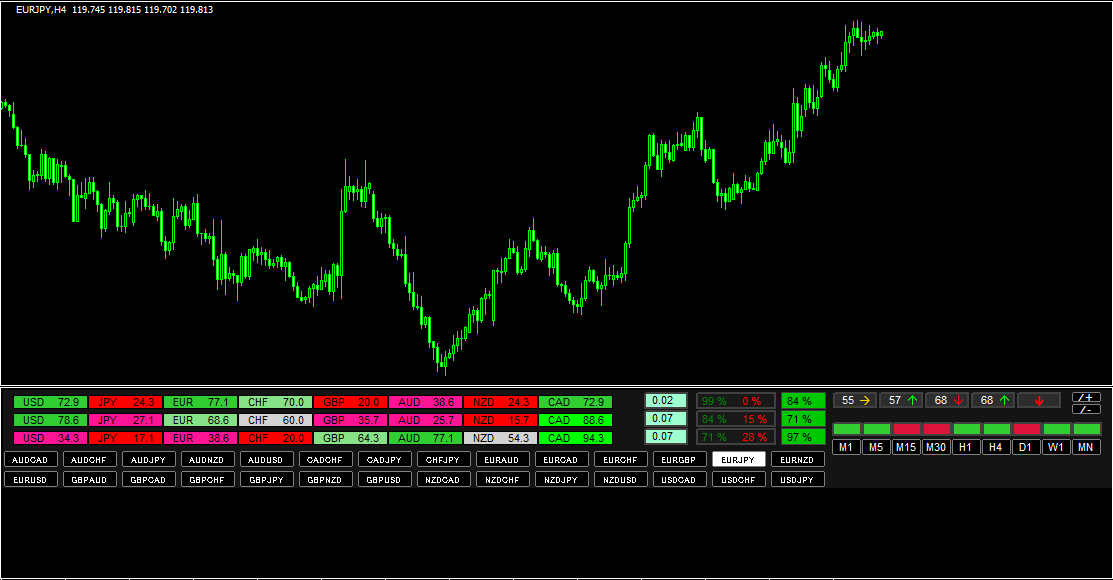 相場状況表示
マルチ通貨ペア、マルチタイムで様々な情報が表示される「Chart Button V2」
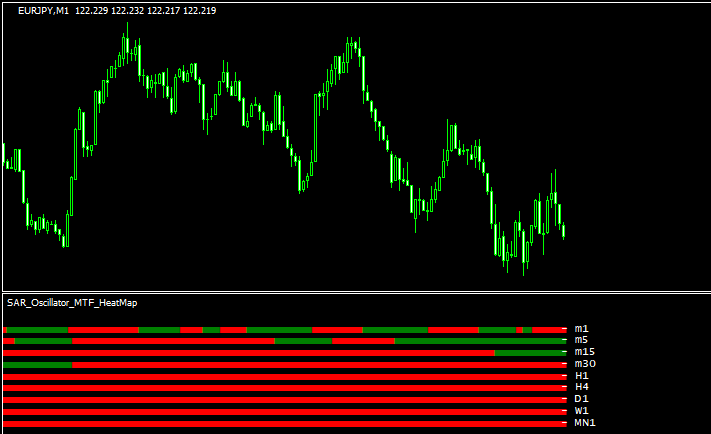 バータイプ
バータイプマルチタイムでパラボリックの状況を表示する「SAR_Oscillator_MTF_Heatmap」
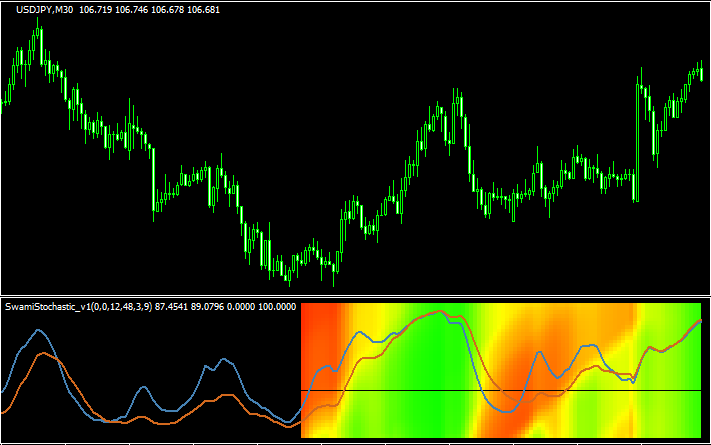 オシレーター
値によって背景の色が変わるオシレーター「SwamiStochastic_v1」
勝てる手法10個+超凄いインジをプレゼント!

\初心者から上級者まで大注目!/
当サイト限定で、XMの口座開設をすると「Forex Standard Club XM版」へ無料招待!
✔️ 期間限定で13,000円のボーナス!
✔️ 最大500ドルまで100%入金ボーナス!
✔️ 勝率を上げるトレード手法&限定インジケーターを多数提供!
将来の動きを予測する無料ツール差し上げます

未来予測インジケーター「Futuro FX」は、過去の動きと現在の動きの相関から少し先の動きを予測します。メルマガ登録で詳しい解説書をプレゼント!
さらにスマートマネーコンセプト(SMC)について解説したPDFもプレゼント!
\初心者から上級者まで大注目!/
当サイト限定で、XMの口座開設をすると「Forex Standard Club XM版」へ無料招待!
✔️ 13,000円のボーナス!
✔️ 最大1000ドルまで100%入金ボーナス!
✔️ 勝率を上げるトレード手法&限定インジケーターを多数提供!