
 バータイプ
バータイプサブチャート
バータイプ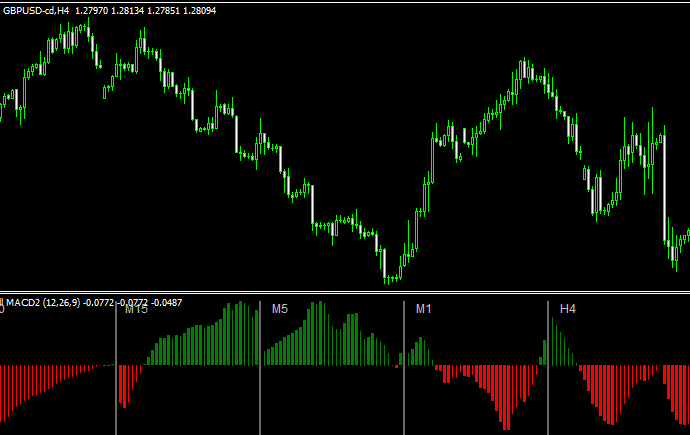 オシレーター
マルチタイムでMACDを表示させる「all_macd_v1.0_nmc_1」
 オシレーター
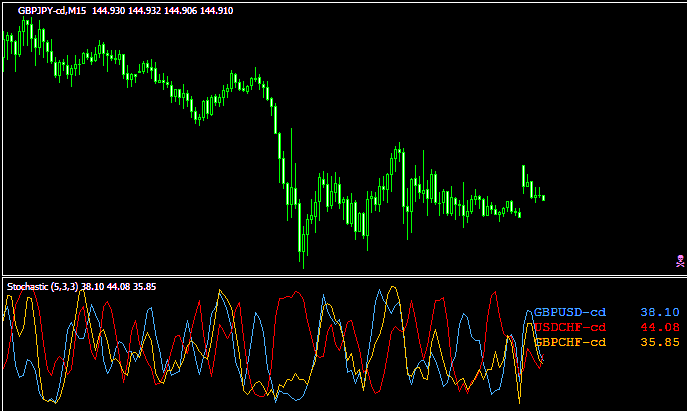
3つの通貨ペアのストキャスを同時に表示する「TRO_Stochastic_THREE_PAIRS」
 オシレーター
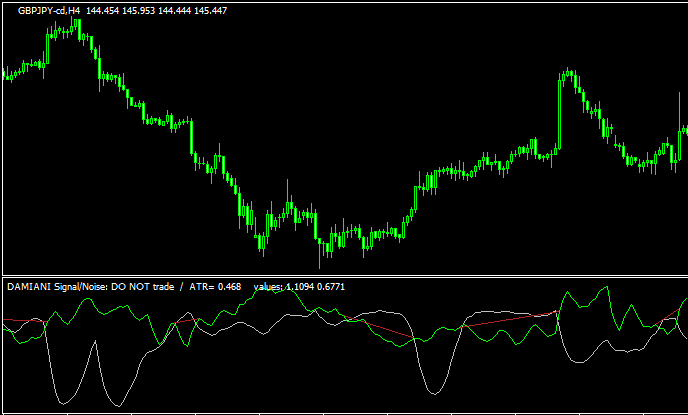
ノイズフィルターとして使える「signal_to_noise」
 その他
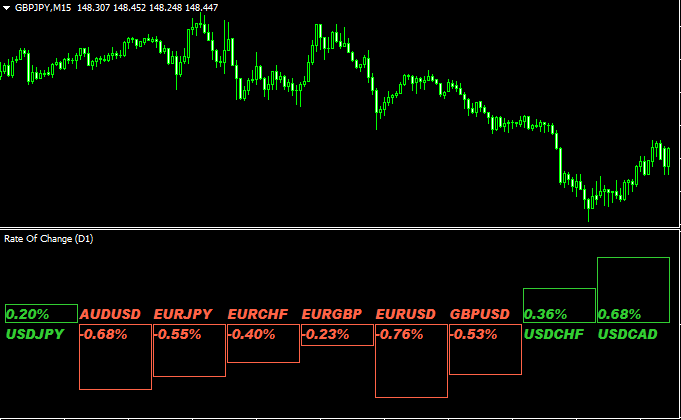
その他チャート下に各通貨ペアの変動率を示す「ROCv2.1」
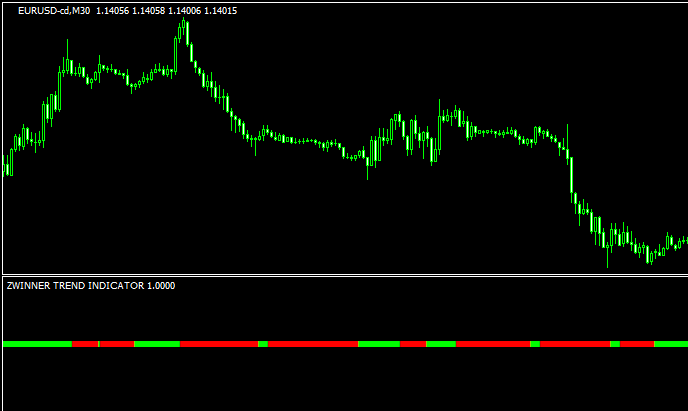
 バータイプ
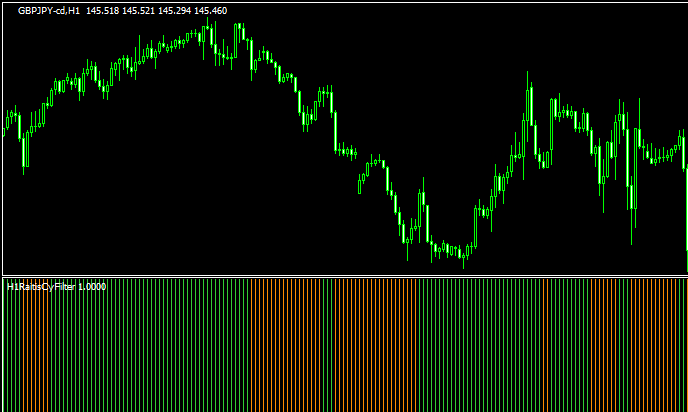
バータイプマルチタイムで相場のトレンド方向が見れる「RaitisCyFilter」
 バータイプ
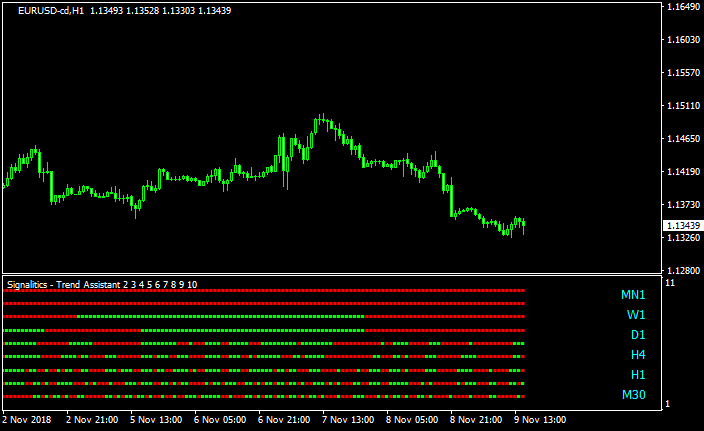
バータイプ30分足以上のトレンド方向をドットで示す「SignaliticsTrendAssistantV1.0」
 オシレーター
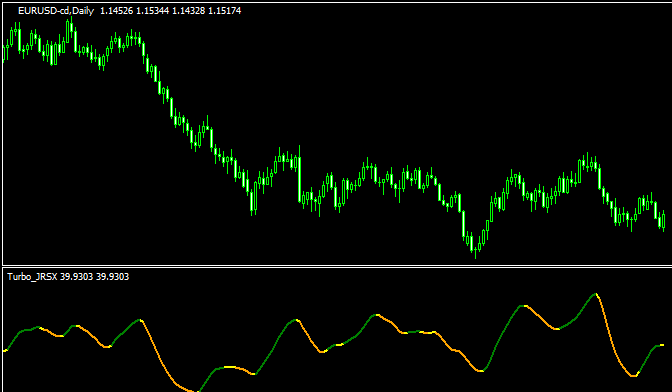
向きで色の変わるオシレーター「3c_turbo_jrsx_filtered」
 オシレーター
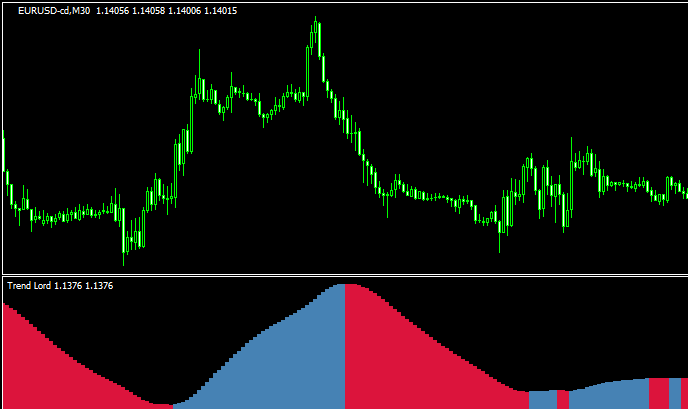
ダイナミックにトレンド方向を示す「TrendLord」
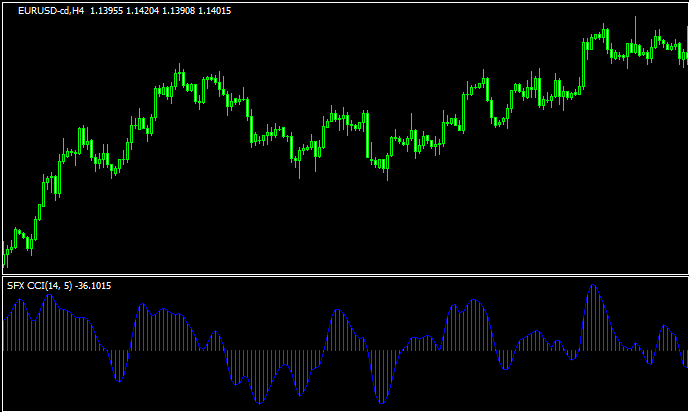 オシレーター
なめらかなCCI「SFX CCI」
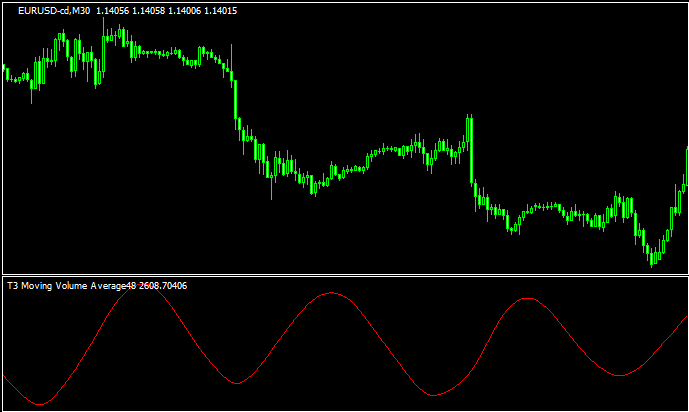 Volume
ボリュームをT3移動平均化する「t3-moving-volume-average」
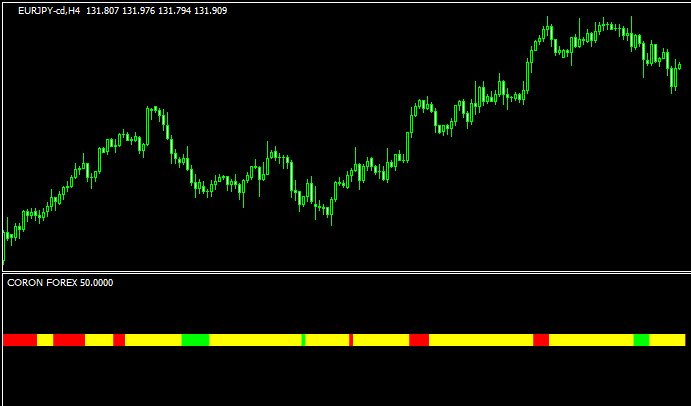 バータイプ
バータイプトレンドの勢いが付いたら色の変わる「coron-forex」
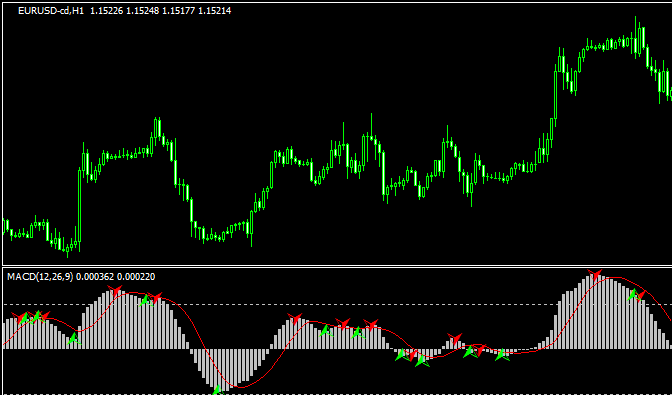 オシレーター
MACDのヒストグラムの上下でサインが出る「macd-pattern-signals」
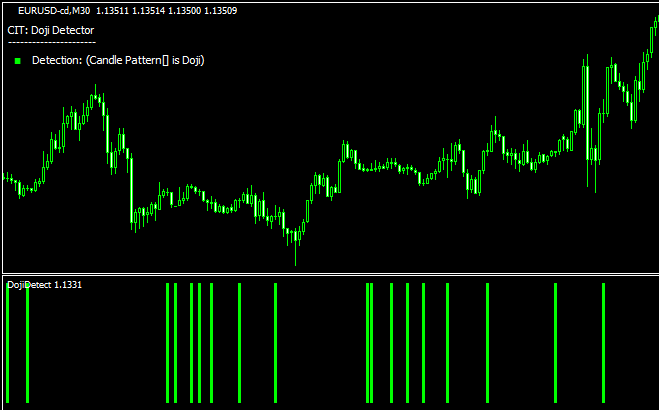 バータイプ
バータイプ同時線(十字線)を検出する「DojiDetect」
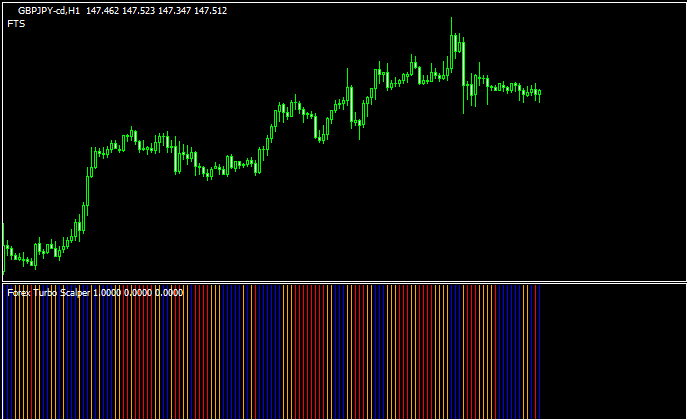 バータイプ
バータイプスキャルピング用?forex-scalper
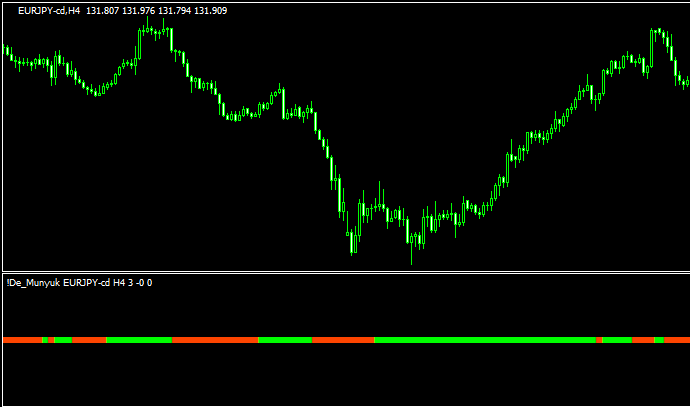 バータイプ
バータイプトレンド方向をバーで示す「de-munyuk-indicator」
勝てる手法10個+超凄いインジをプレゼント!

\初心者から上級者まで大注目!/
当サイト限定で、XMの口座開設をすると「Forex Standard Club XM版」へ無料招待!
✔️ 期間限定で13,000円のボーナス!
✔️ 最大500ドルまで100%入金ボーナス!
✔️ 勝率を上げるトレード手法&限定インジケーターを多数提供!
将来の動きを予測する無料ツール差し上げます

未来予測インジケーター「Futuro FX」は、過去の動きと現在の動きの相関から少し先の動きを予測します。メルマガ登録で詳しい解説書をプレゼント!
さらにスマートマネーコンセプト(SMC)について解説したPDFもプレゼント!
\初心者から上級者まで大注目!/
当サイト限定で、XMの口座開設をすると「Forex Standard Club XM版」へ無料招待!
✔️ 13,000円のボーナス!
✔️ 最大1000ドルまで100%入金ボーナス!
✔️ 勝率を上げるトレード手法&限定インジケーターを多数提供!