
 相場状況表示
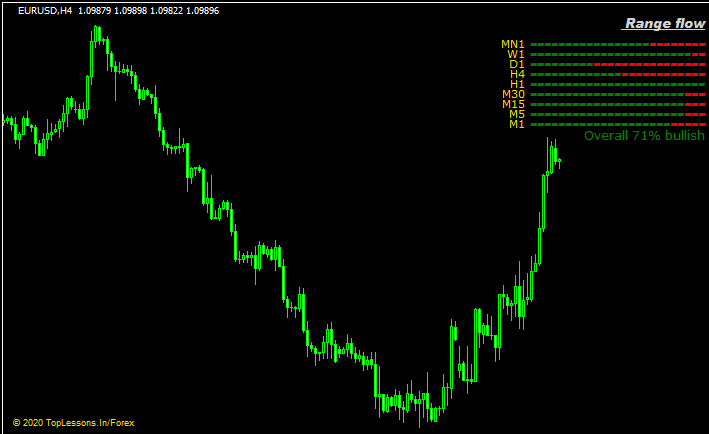
メイン相場状況表示
相場状況表示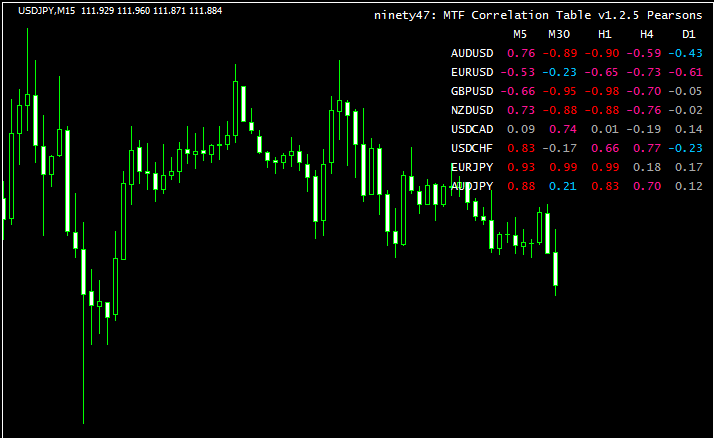 相場状況表示
マルチタイムで相関のある通貨ペアがわかる「ninety47_CorrelationTable_v1.2.5」
 相場状況表示
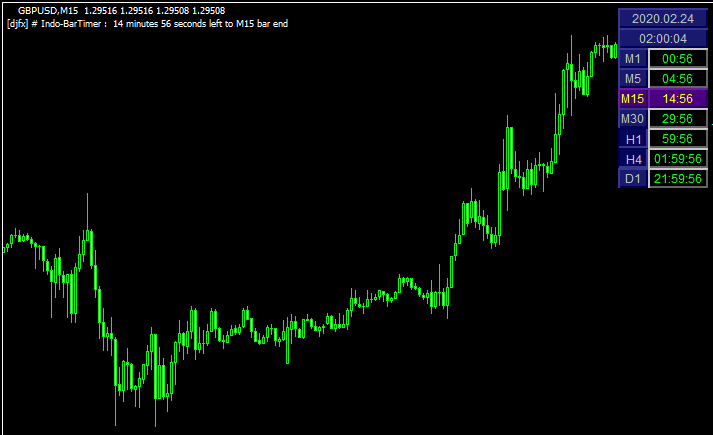
各時間足が確定するまでの時間が一目で分かる「Indo-BarTimer」
 相場状況表示
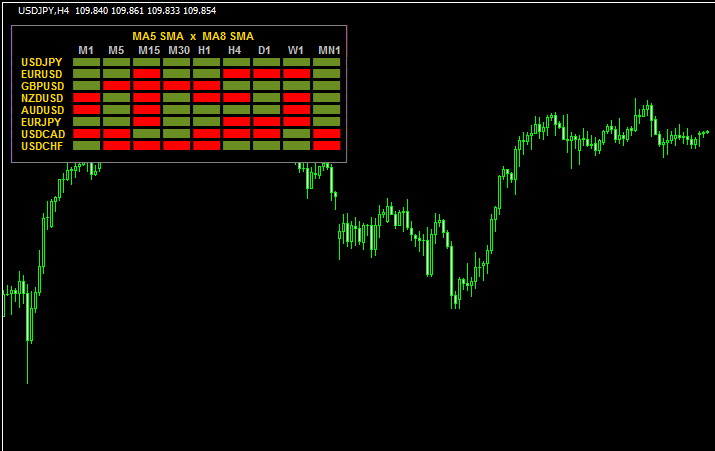
マルチタイム、マルチ通貨ペアでMAのクロス状況が分かる「MTF MA Multi Pair Dashboard」
 相場状況表示
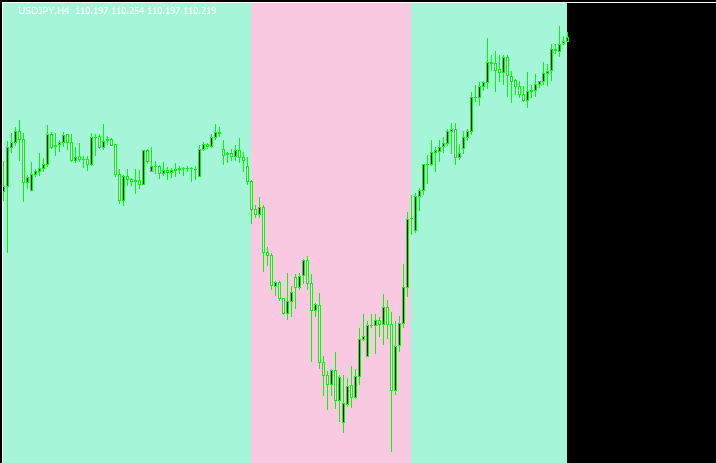
相場が上か下かで背景の色が変わる「Supertrend zones 2.01 nmc」
 相場状況表示
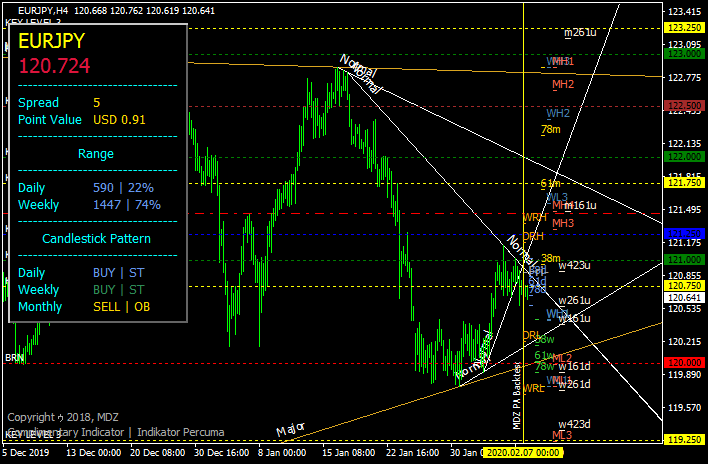
何か色々と凄い「Mdz Price Action Indicator」
 相場状況表示
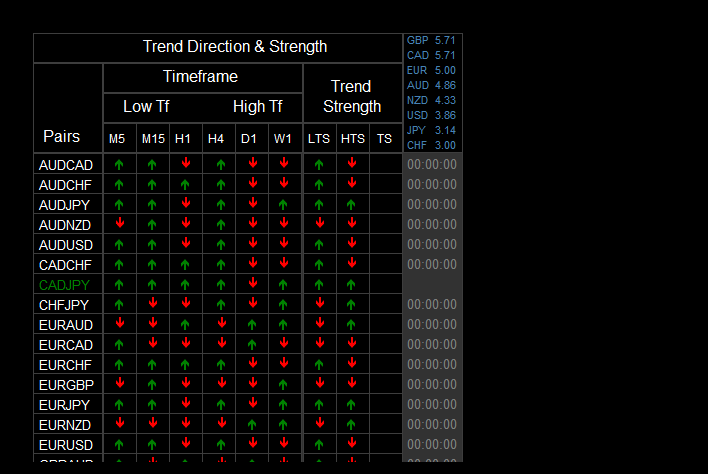
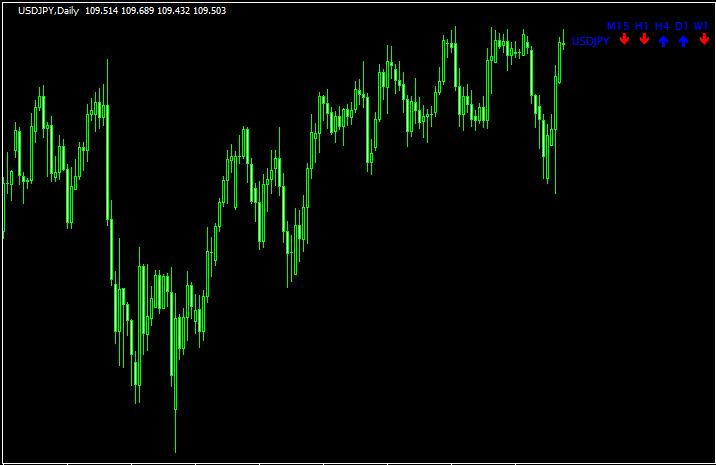
マルチタイムでトレンド方向や通貨の強さが分かる「CandleDirectionStoxos_2」
 相場状況表示
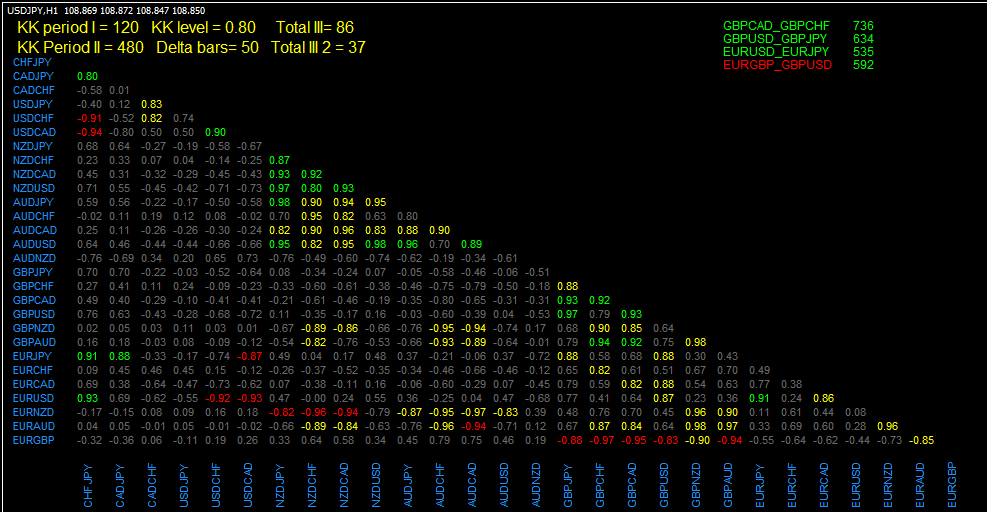
通貨ペアごとの相関がわかる「multi_pairs_correlation_piramida_v2.01_eng」
 相場状況表示
マルチタイムでEMAより上か下かが分かる「TMS 10EMA Dashboard」
 相場状況表示
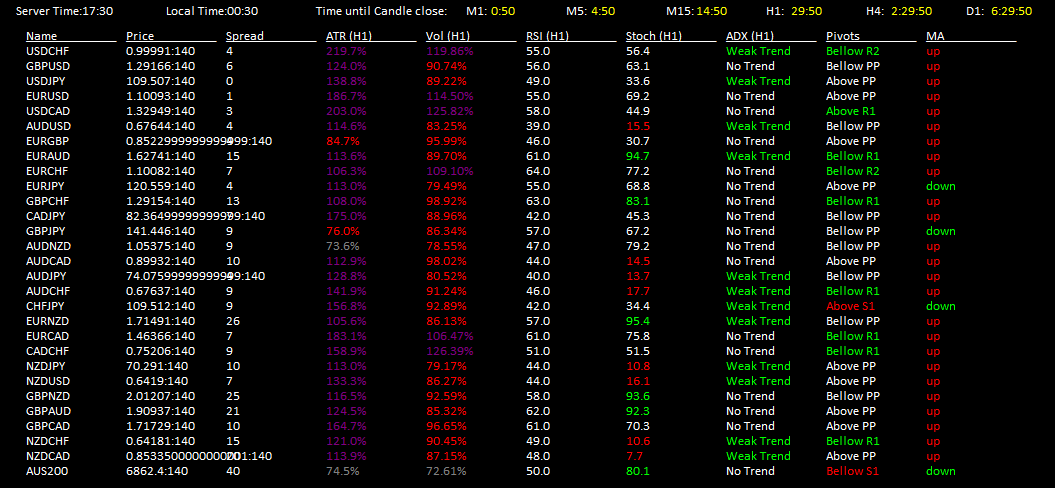
様々なインジケーターの状態が一覧で表示される「FXTT_Fx_Scanner」
 相場状況表示
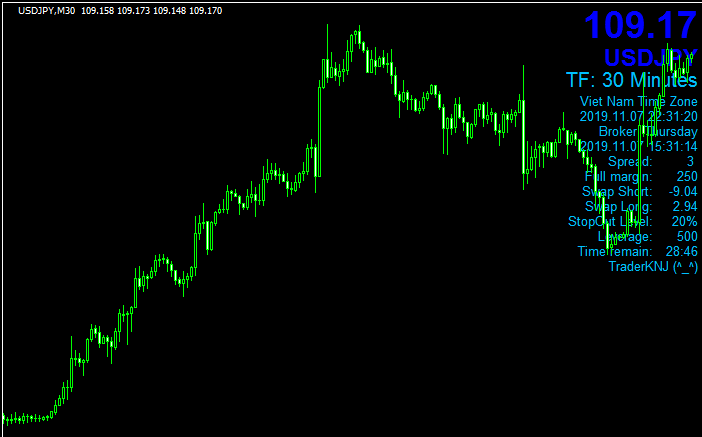
相場の状況を示す「01_full_info」
 相場状況表示
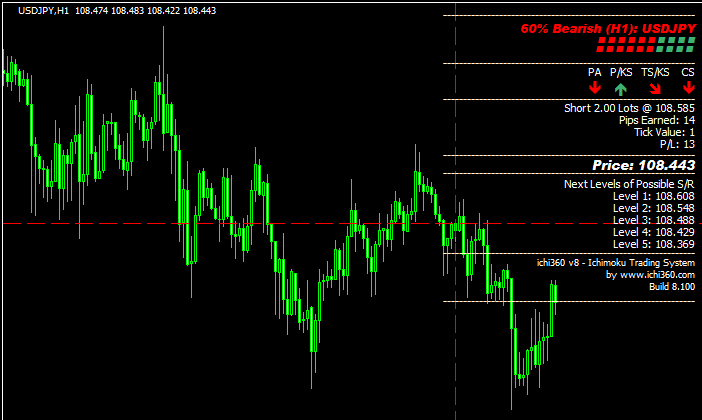
一目均衡表の状況とサポレジレートを示す「ichimoku kinko hyo system」
 相場状況表示
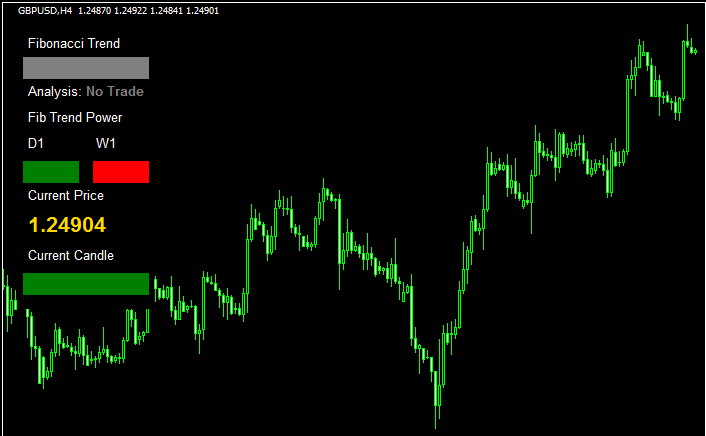
フィボナッチをベースとしてトレンド方向を示す「FibonacciTrend」
 相場状況表示
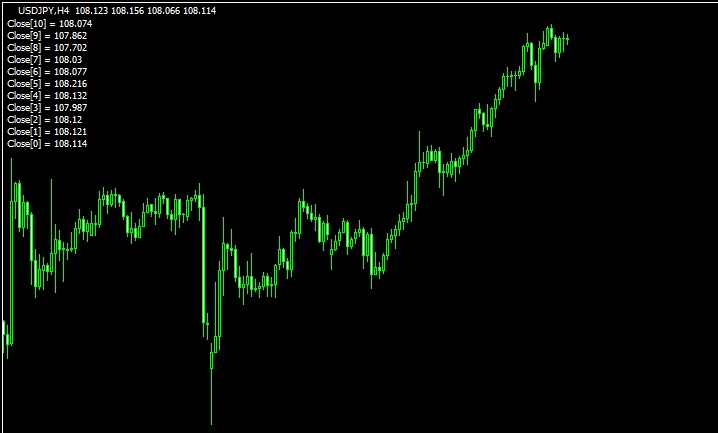
10本前までのローソク足の終値を一覧で表示する「hemnina」
 相場状況表示
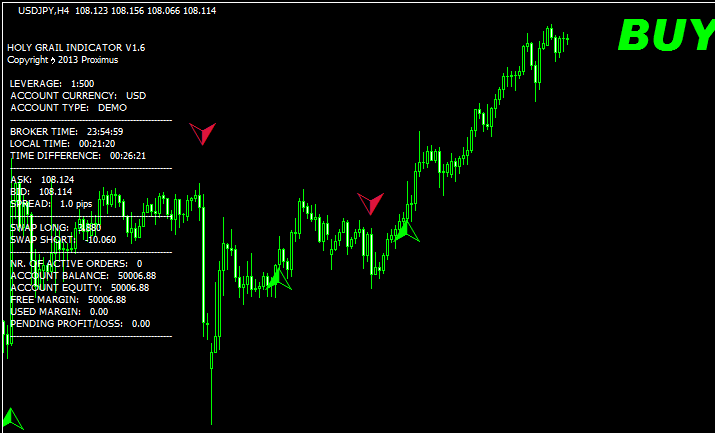
聖杯が存在した?「HOLY GRAIL 1.6」
 相場状況表示
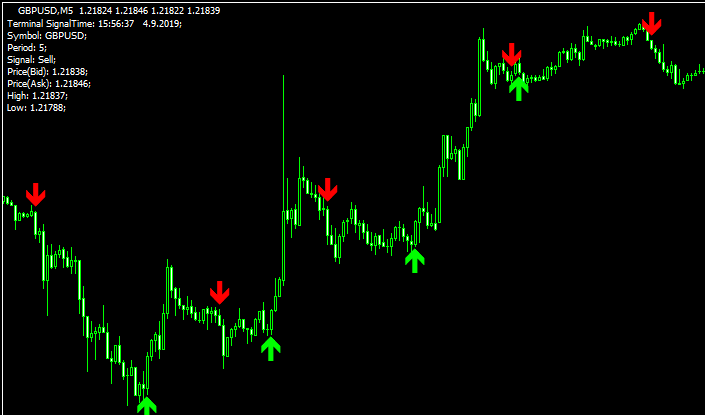
損小利大型のシグナルを出す「gann-signal-indicator」
勝てる手法10個+超凄いインジをプレゼント!

\初心者から上級者まで大注目!/
当サイト限定で、XMの口座開設をすると「Forex Standard Club XM版」へ無料招待!
✔️ 期間限定で13,000円のボーナス!
✔️ 最大500ドルまで100%入金ボーナス!
✔️ 勝率を上げるトレード手法&限定インジケーターを多数提供!
将来の動きを予測する無料ツール差し上げます

未来予測インジケーター「Futuro FX」は、過去の動きと現在の動きの相関から少し先の動きを予測します。メルマガ登録で詳しい解説書をプレゼント!
さらにスマートマネーコンセプト(SMC)について解説したPDFもプレゼント!
\初心者から上級者まで大注目!/
当サイト限定で、XMの口座開設をすると「Forex Standard Club XM版」へ無料招待!
✔️ 13,000円のボーナス!
✔️ 最大1000ドルまで100%入金ボーナス!
✔️ 勝率を上げるトレード手法&限定インジケーターを多数提供!