
 オシレーター
サブチャート
オシレーター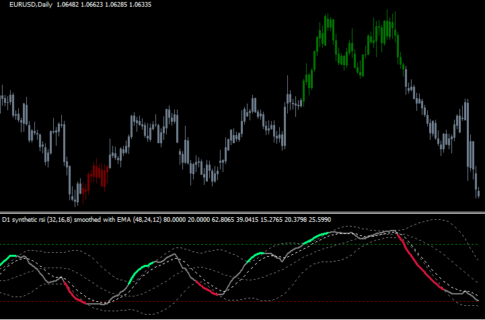 オシレーター
RSIをベースとしたインジのセット「synthetic rsi」
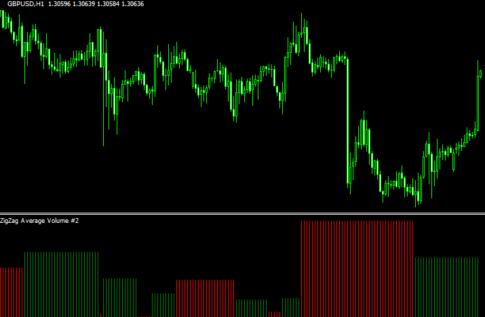 ジグザグ系
ジグザグ系ジグザグの各波のトータルボリュームを示す「ZigZag_Total_Volume」
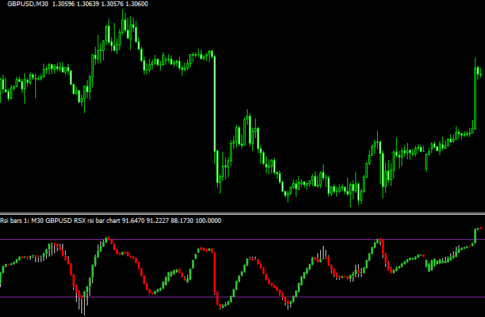 オシレーター
RSIをローソク足表示にした「! rsi bar chart (mtf + alerts + multisymbol)」
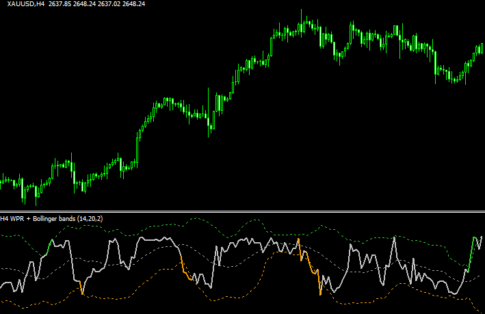 オシレーター
WPRにボリバンを追加した「! wpr with bollinger bands (mtf + alerts)」
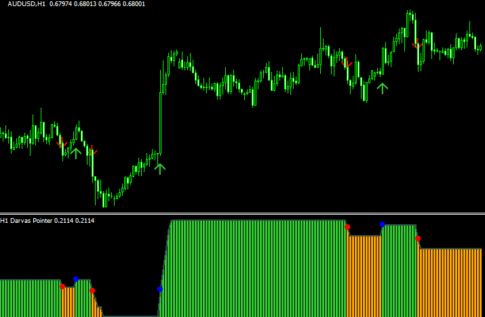 オシレーター
ダーバスボックスをベースとしたオシレーター「Forex Darvas Pointer」
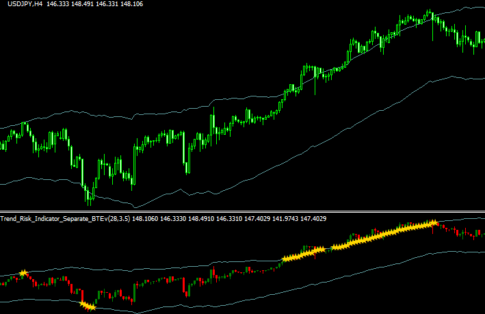 バンドタイプ
相場の行きすぎを示す「Trend_Risk_Indicator」
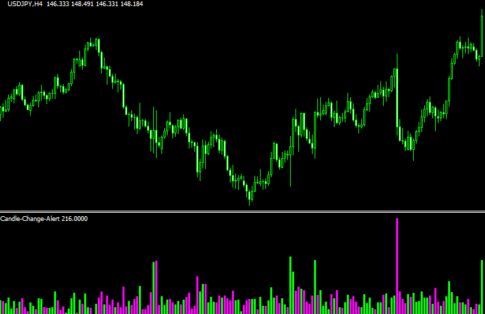 オシレーター
陽線⇒陰線、陰線⇒陽線と切り替わったらアラートが鳴る「Candle-Change-Alert」
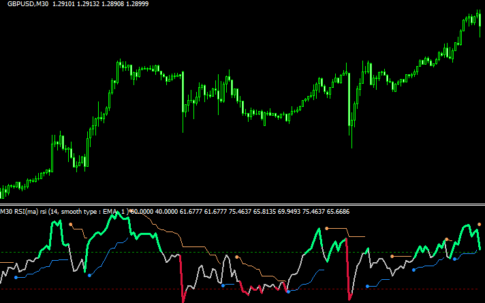 オシレーター
RSIに複数のバンドを追加してサインも出る「xRsi(+ma + bands + mtf)」
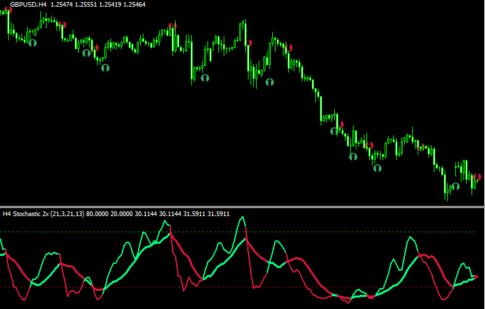
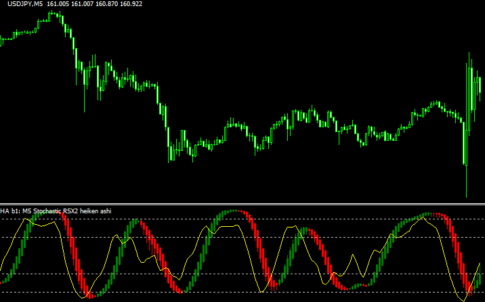 オシレーター
ストキャスティクスRSIを表示してダイバージェンスも認識する「! stoch rsi ha avgs – smoothed (mtf + sw + alerts + divergence)」
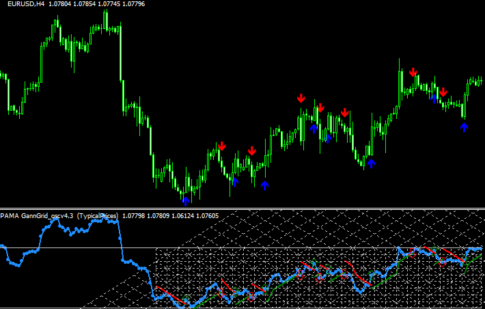 オシレーター
波の切り替わりでサインが出るオシレーター「PAMA GannGrid_oscv4.3 Alert」
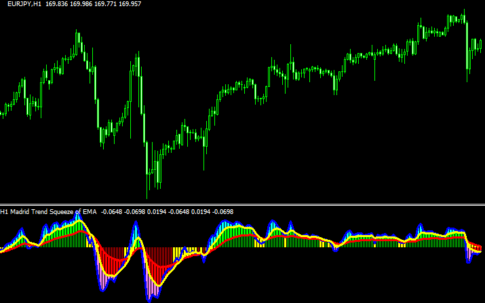 オシレーター
相場のスクイーズやトレンド方向が客観的に分かる「! Madrid trend squeeze – avgs (mtf) 」
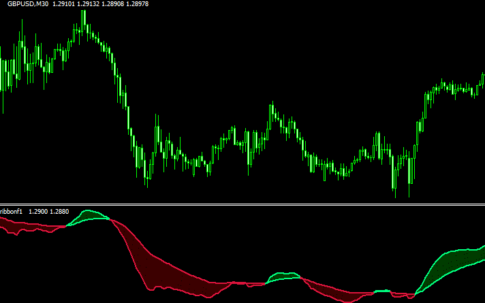 オシレーター
サブチャートにリボンを表示する「ribbon(+sw)」
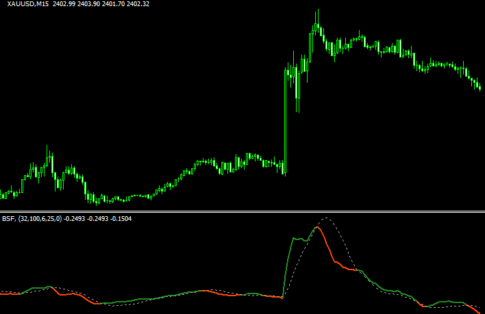 オシレーター
トレンドの勢いが出ているポイントが分かりやすい「Behgozin Strength Finder + alerts 2 lines」
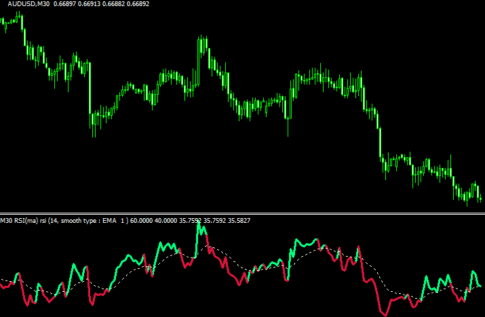 オシレーター
RSIについて様々な条件でサインを出せる「xRsi(+ma) 1.3」
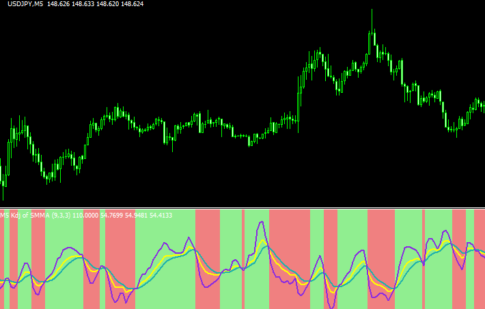 オシレーター
ストキャスから派生したオシレーター「KDJ + histo avgs (mtf + alerts)」
勝てる手法10個+超凄いインジをプレゼント!

\初心者から上級者まで大注目!/
当サイト限定で、XMの口座開設をすると「Forex Standard Club XM版」へ無料招待!
✔️ 期間限定で13,000円のボーナス!
✔️ 最大500ドルまで100%入金ボーナス!
✔️ 勝率を上げるトレード手法&限定インジケーターを多数提供!
将来の動きを予測する無料ツール差し上げます

未来予測インジケーター「Futuro FX」は、過去の動きと現在の動きの相関から少し先の動きを予測します。メルマガ登録で詳しい解説書をプレゼント!
さらにスマートマネーコンセプト(SMC)について解説したPDFもプレゼント!
\初心者から上級者まで大注目!/
当サイト限定で、XMの口座開設をすると「Forex Standard Club XM版」へ無料招待!
✔️ 13,000円のボーナス!
✔️ 最大1000ドルまで100%入金ボーナス!
✔️ 勝率を上げるトレード手法&限定インジケーターを多数提供!