
 オシレーター
オシレーター
オシレーター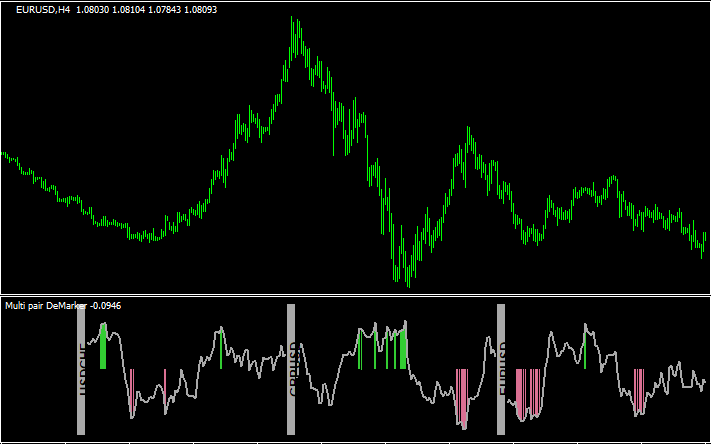 オシレーター
マルチ通貨ペアでデマーカーが表示される「multi_pair_demarker_nmc」
 オシレーター
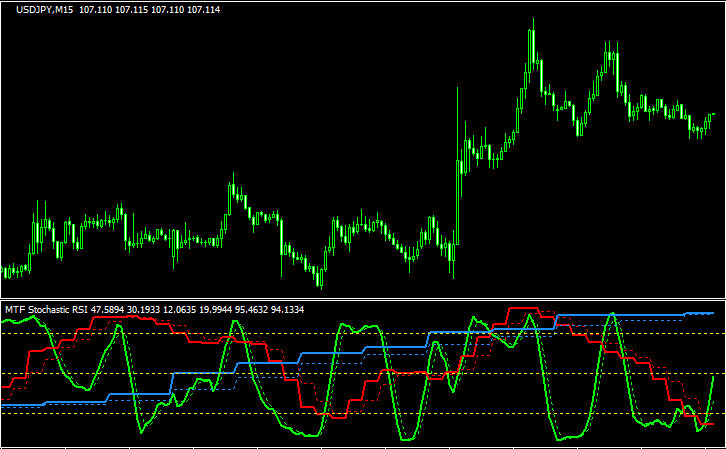
3つの時間足でストキャスティクスRSIを表示させる「MTF_Stochastic_RSI」
 オシレーター
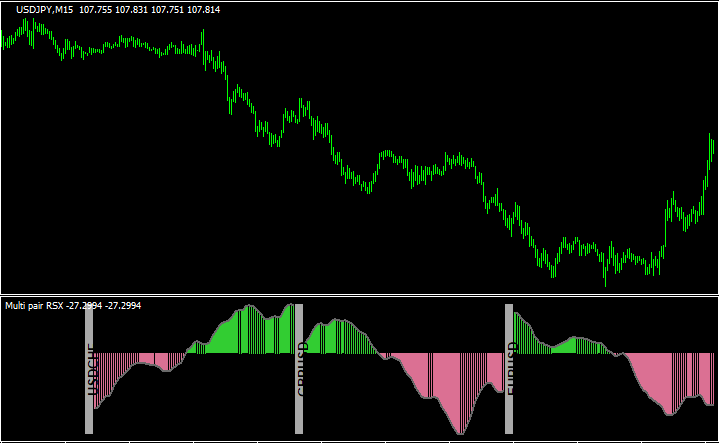
マルチ通貨ペア・マルチタイムでRSXを表示する「multi_pair_rsx_nmc」
 オシレーター
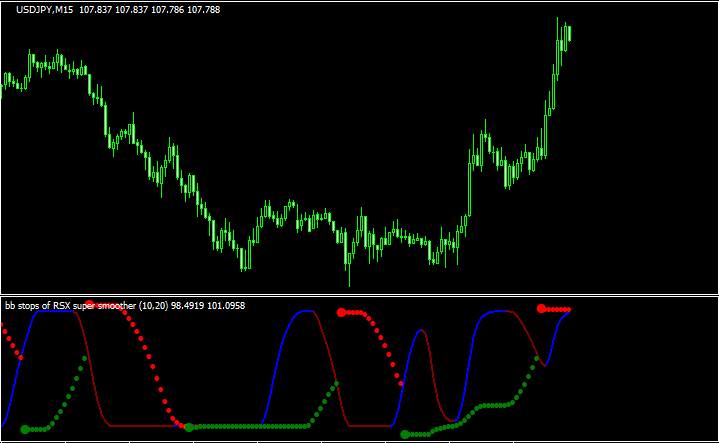
BB StopsをRSIに適用させた「bb_stops_rsi_super_smooth」
 オシレーター
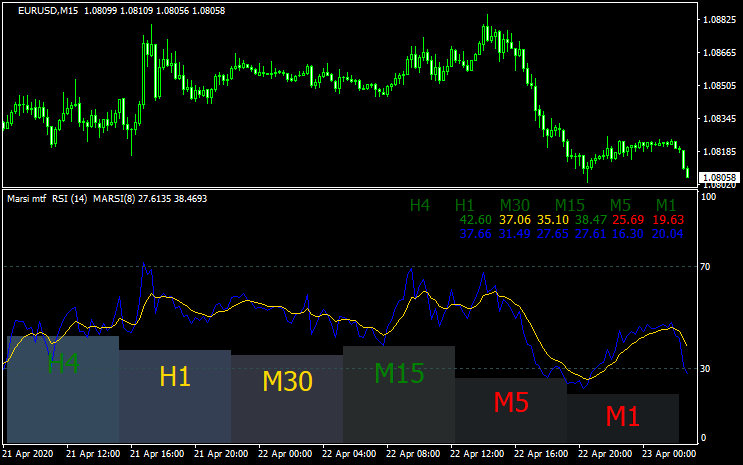
マルチタイムでMA化したRSIが見える「Marsi mtf」
 オシレーター
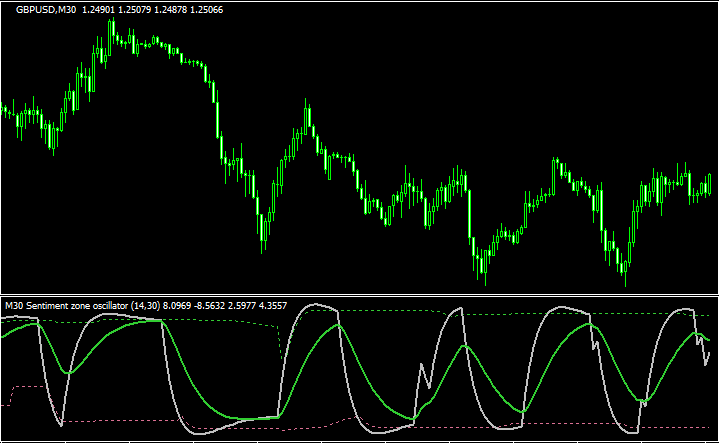
2つの期間のセンチメントゾーンオシレーターを表示する「sentiment-zone-oscillator」
 オシレーター
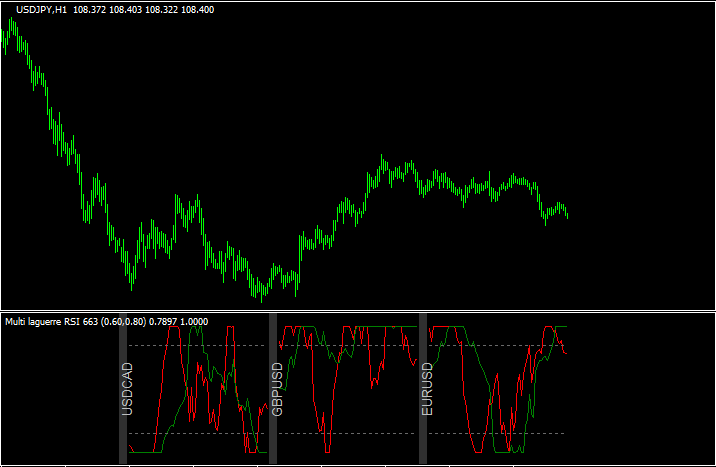
マルチ通貨ペアでラゲールRSIを表示させる「multi_pair_laguerre_rsi」
 オシレーター
チャイキン・マネー・フローベースとした「Chalkin Money Flow Teamtrader」
 オシレーター
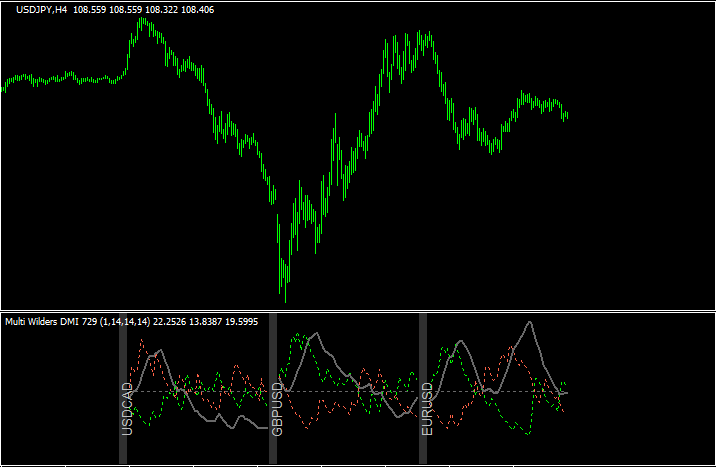
マルチ通貨ペアでDMIが表示できる「multi_pair_wilders_dmi」
 オシレーター
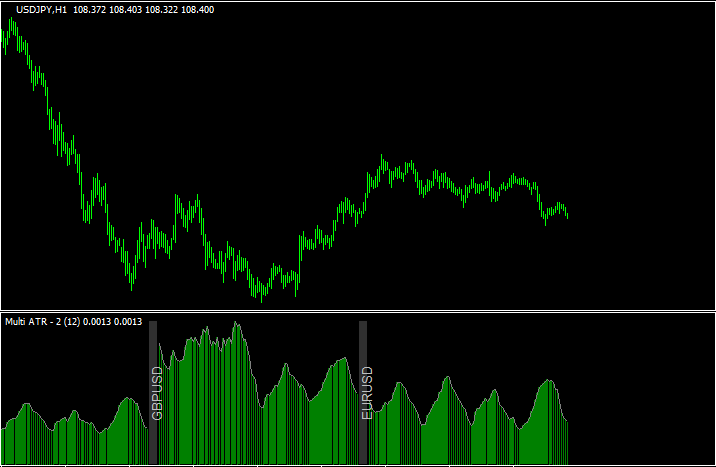
マルチ通貨ペアでATRを表示できる「multi_pair_atr」
 オシレーター
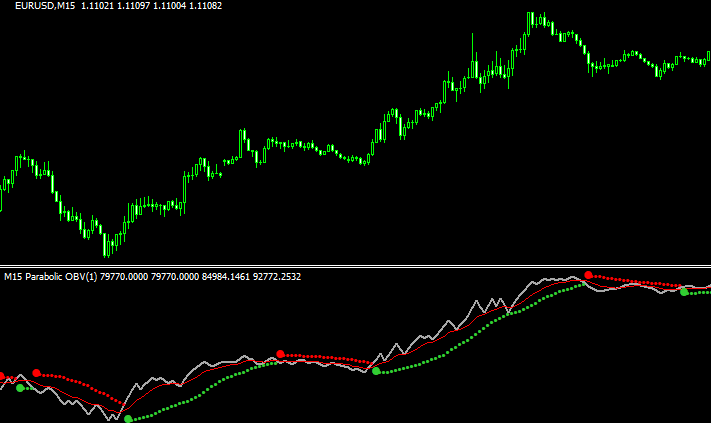
パラボリックとOn Balance Volumeのコラボ「Parabolic obv v1 mtf」
 オシレーター
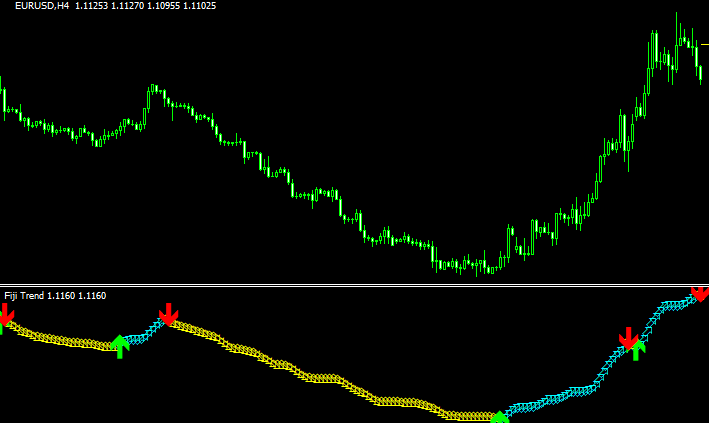
トレンドが切り替わるとサインの出る「fiji-trend-indicator」
 オシレーター
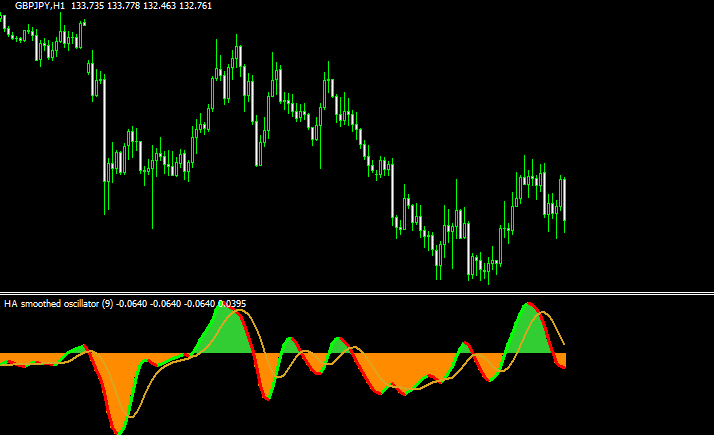
平均足スムーズドをオシレーター化した「heiken ashi smoothed oscillator」
 オシレーター
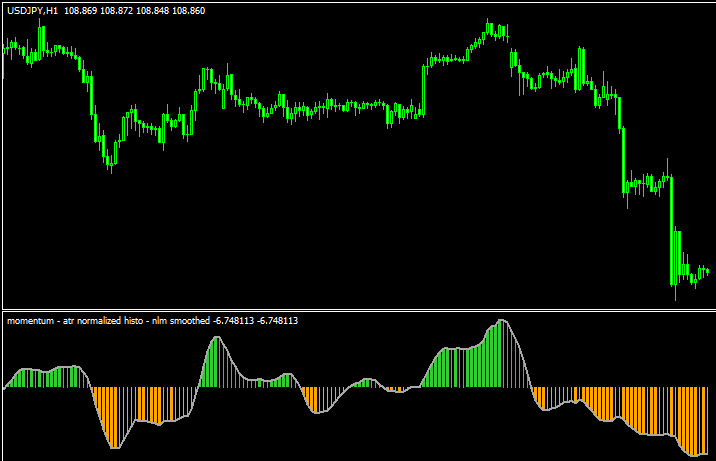
モメンタムをベースとした「momentum – atr normalized histo – nlm smoothed 」
 オシレーター
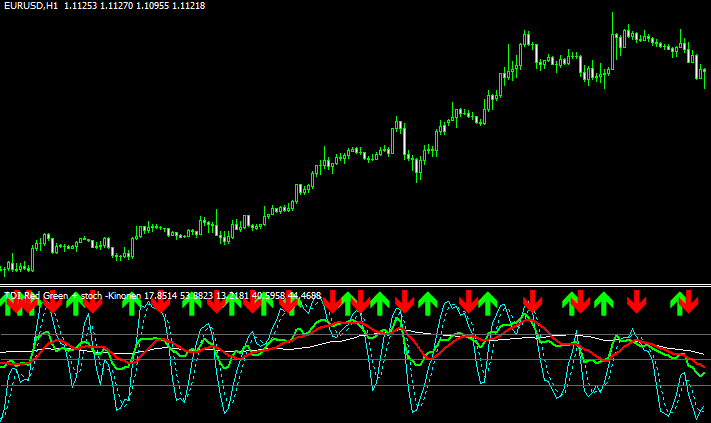
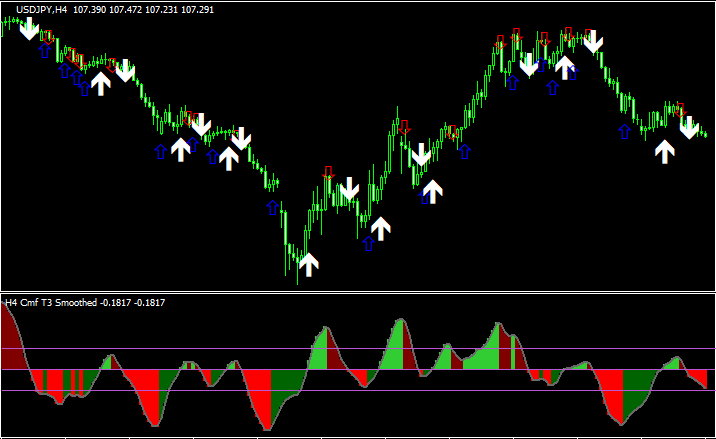
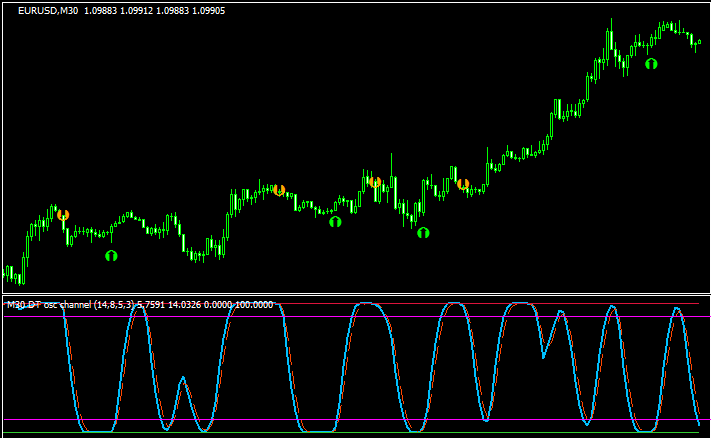
色々な指標を組み合わせたオシレーター「DTosc_Channel_arrows nmc」
勝てる手法10個+超凄いインジをプレゼント!

\初心者から上級者まで大注目!/
当サイト限定で、XMの口座開設をすると「Forex Standard Club XM版」へ無料招待!
✔️ 期間限定で13,000円のボーナス!
✔️ 最大500ドルまで100%入金ボーナス!
✔️ 勝率を上げるトレード手法&限定インジケーターを多数提供!
将来の動きを予測する無料ツール差し上げます

未来予測インジケーター「Futuro FX」は、過去の動きと現在の動きの相関から少し先の動きを予測します。メルマガ登録で詳しい解説書をプレゼント!
さらにスマートマネーコンセプト(SMC)について解説したPDFもプレゼント!
\初心者から上級者まで大注目!/
当サイト限定で、XMの口座開設をすると「Forex Standard Club XM版」へ無料招待!
✔️ 13,000円のボーナス!
✔️ 最大1000ドルまで100%入金ボーナス!
✔️ 勝率を上げるトレード手法&限定インジケーターを多数提供!