
 マーケットプロファイル
マーケットプロファイル
マーケットプロファイル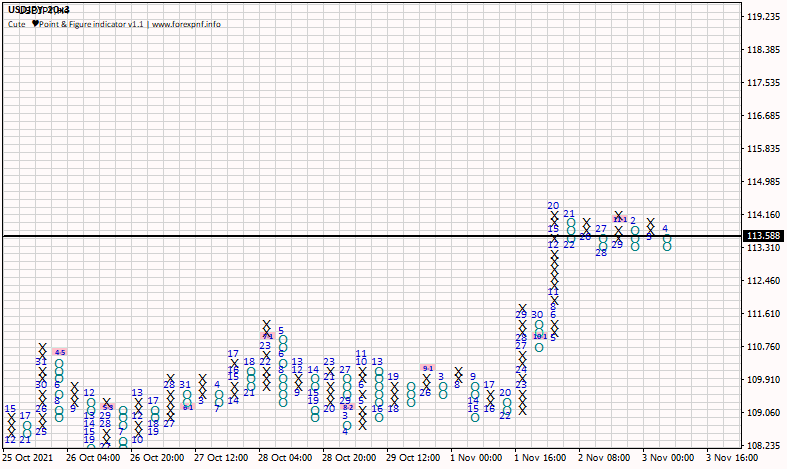 マーケットプロファイル
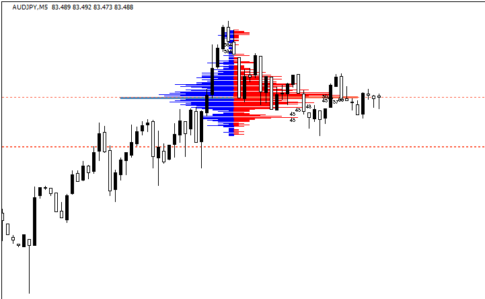
MT4でポイント&フィギュアを表示する「Cute_PNF」
 マーケットプロファイル
マーケットプロファイルをオンオフできる最新版「MarketProfile v1.16 button」
 マーケットプロファイル
マーケットプロファイルをオンオフできる「MarketProfile_v1.15 button 1.01」
 マーケットプロファイル
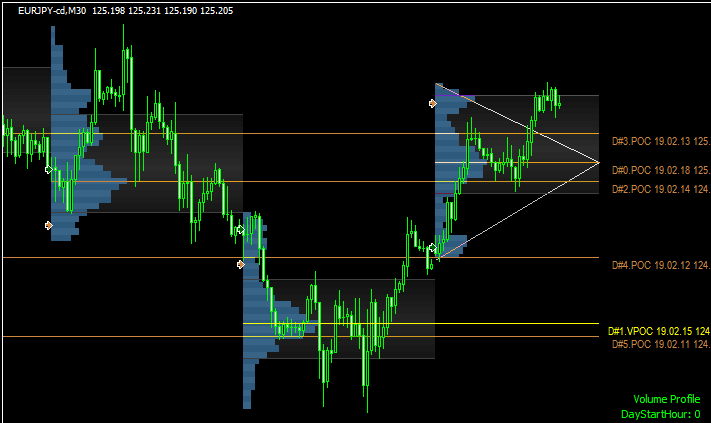
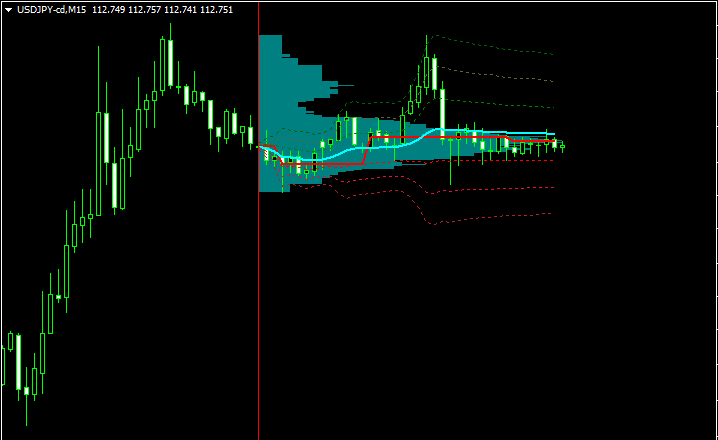
機能が充実したボリュームプロファイル「VP-Range-v6」
 マーケットプロファイル
ボリュームプロファイルが表示できる「OrderBook」
 マーケットプロファイル
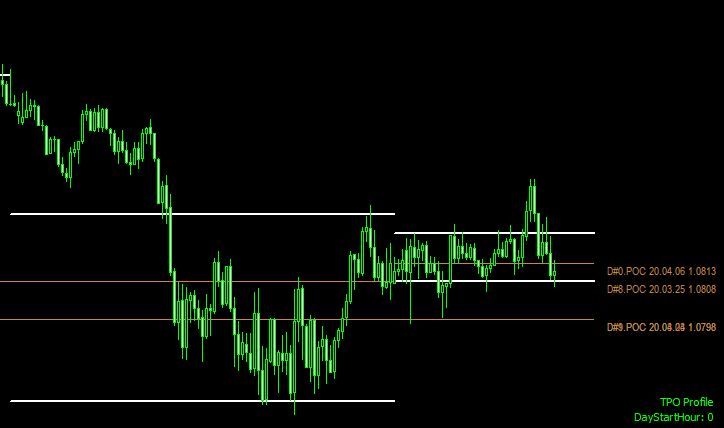
見やすいマーケットプロファイル「ay-MarketProfileDWM.v1.31.rev1.1(nmc)」
 マーケットプロファイル
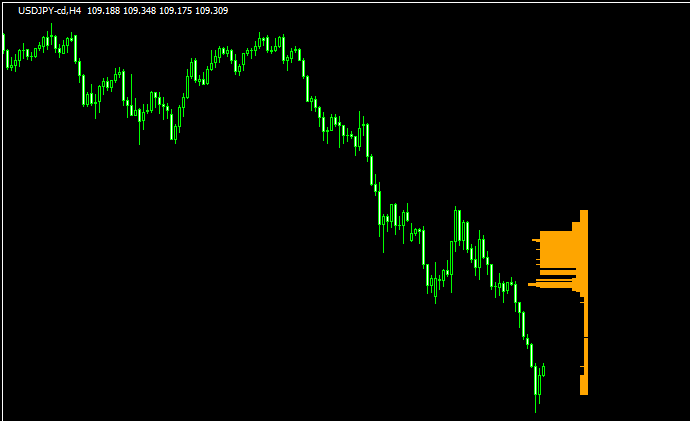
プライスバンド(価格帯別出来高)が表示できる「00-PriceBand」
 マーケットプロファイル
市場ごとに色わけされたマーケットプロファイル「R-MarketProfile」
 マーケットプロファイル
週足用のマーケットプロファイル「23tpo-cv4」
 マーケットプロファイル
マーケットプロファイルにトレンドラインも表示させる「marketprofile_trendlines」
 マーケットプロファイル
Level Sensor
 マーケットプロファイル
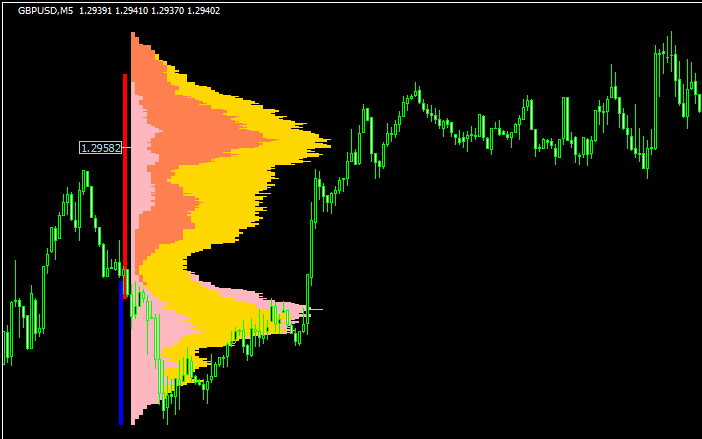
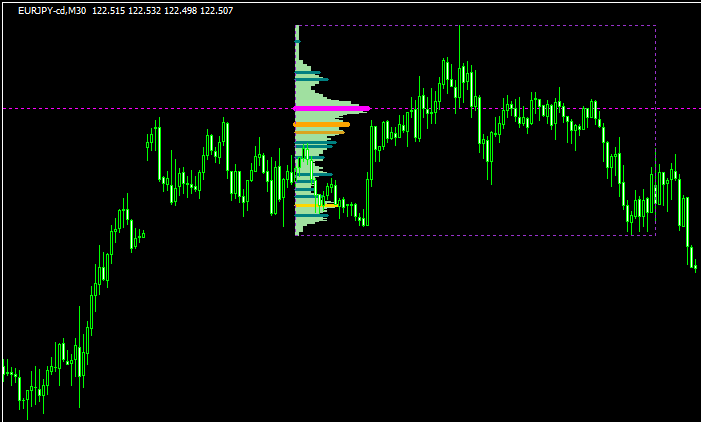
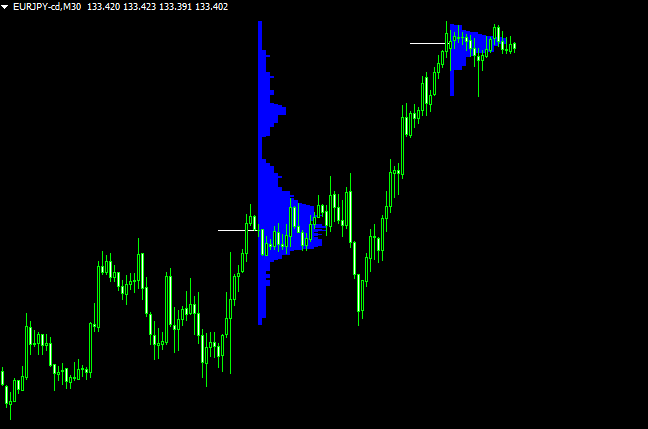
意識されやすい価格帯が丸わかり!「pricehistgram_onclick」
 マーケットプロファイル
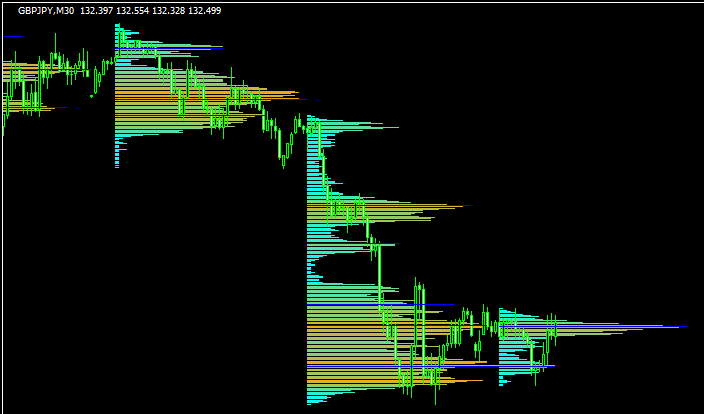
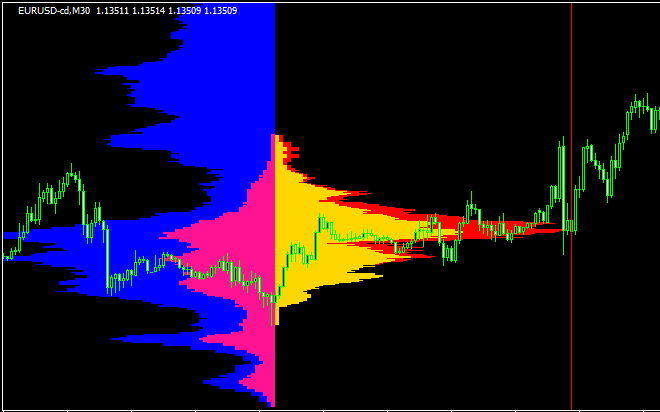
時間帯によって色が変わるマーケットプロファイル「MarketProfileCustomColor」
 マーケットプロファイル
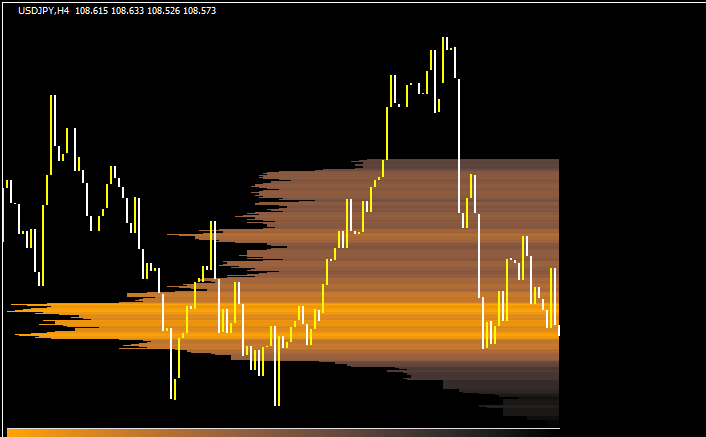
スタンダードなマーケットプロファイルを表示「market profile」
 マーケットプロファイル
マーケットプロファイルを表示する「market-statistics」
勝てる手法10個をプレゼントします。

\初心者から上級者まで大注目!/
当サイト限定で、XMの口座開設をすると「Forex Standard Club XM版」へ無料招待! ✔️ 13,000円のボーナス! ✔️ 最大500ドルまで100%入金ボーナス! ✔️ 勝率を上げるトレード手法&限定インジケーターを多数提供!