
 通貨強弱
通貨強弱通貨強弱
通貨強弱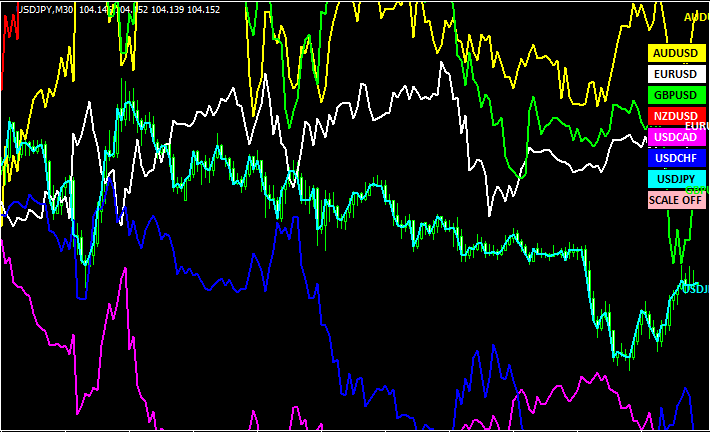 通貨強弱
通貨強弱ドルストレートの流れを全部表示する「Correlations Multipair USD Buttons」
 通貨強弱
通貨強弱マルチタイムで通貨の強弱を数値化する「CMS_BidRatio MTF」
 通貨強弱
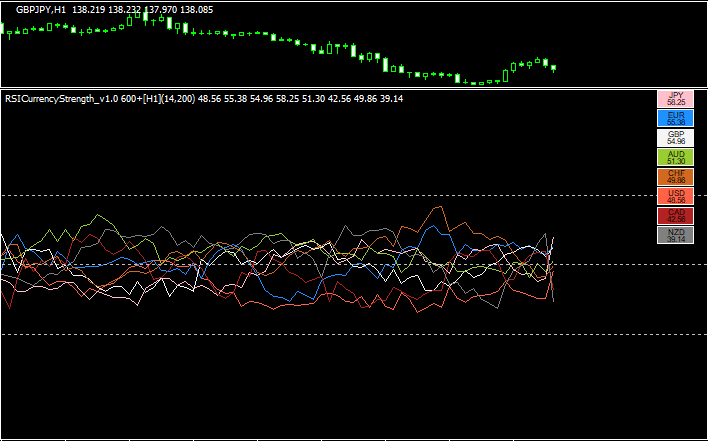
通貨強弱RSIをベースにして通貨の強弱を示す「RSICurrencyStrength_v1.0 」
 通貨強弱
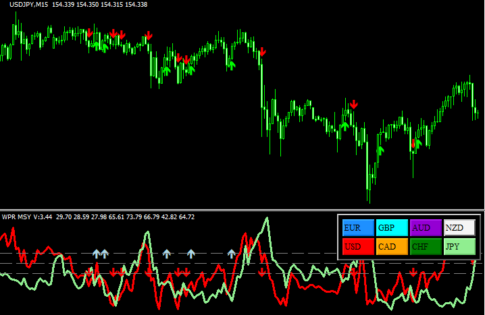
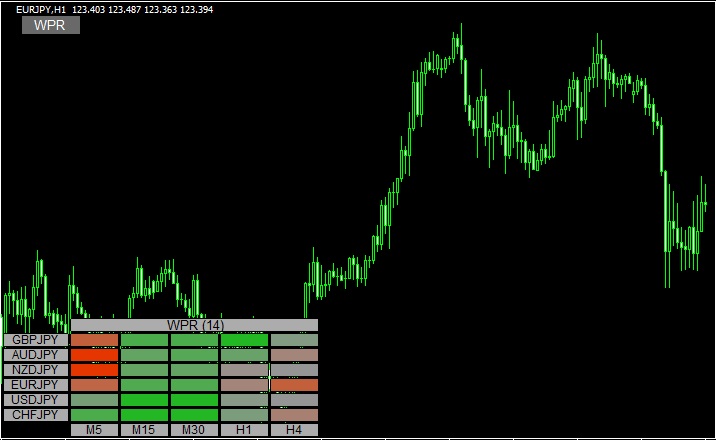
通貨強弱WRPでヒートマップを表示する「WPR Heatmap button」
 通貨強弱
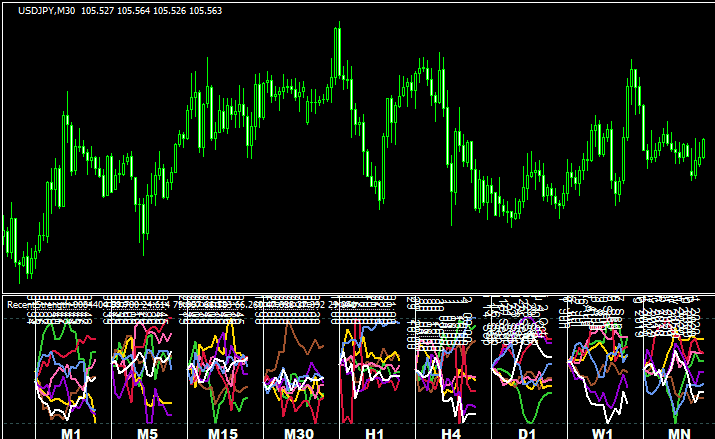
通貨強弱マルチタイムで通貨の強弱の流れを示す「RecentStrength」
 通貨強弱
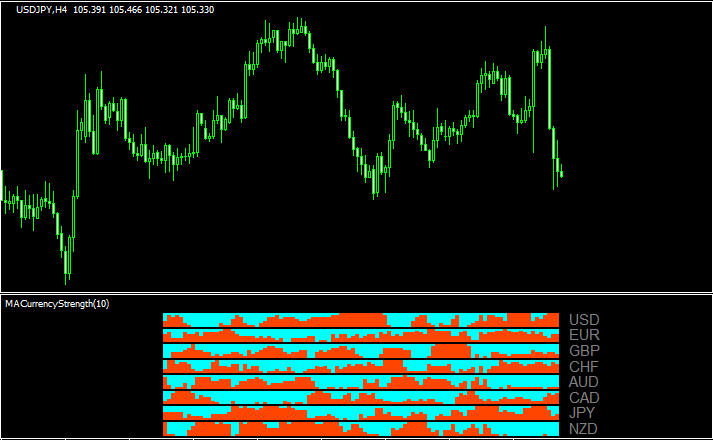
通貨強弱MAを使って通貨の強弱を示す「MACurrencyStrength」
 通貨強弱
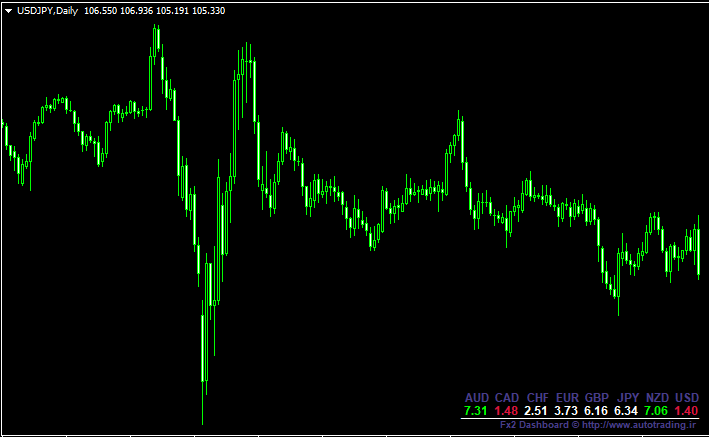
通貨強弱通貨の強弱が表示される「Oasis Dashboard」
 通貨強弱
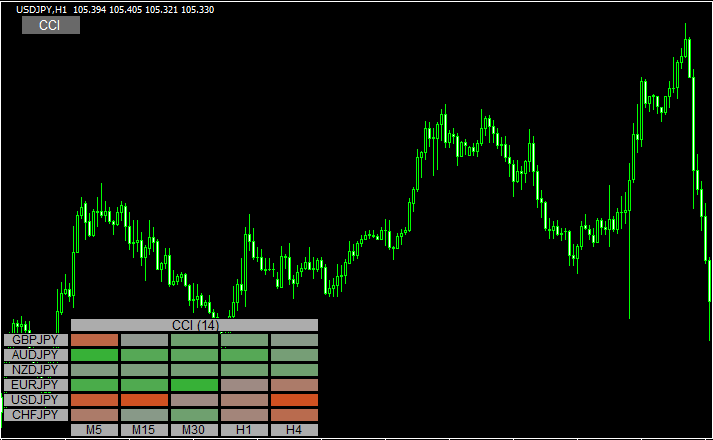
通貨強弱マルチタイム・マルチ通貨ペアでトレンド方向が分かる「CCI Heatmap button」
 通貨強弱
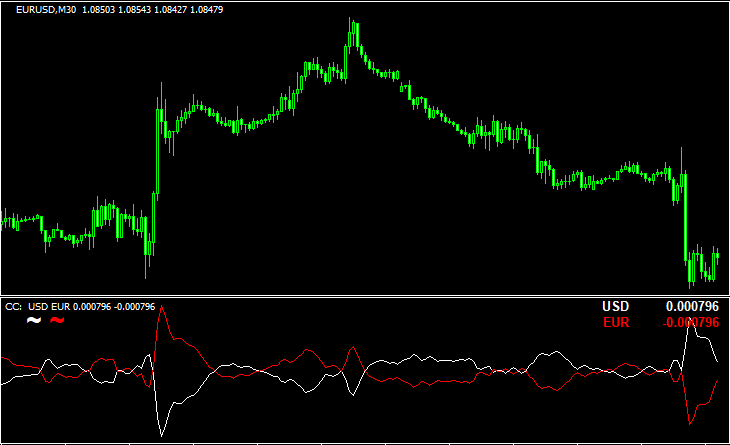
通貨強弱通貨の強弱の推移を示す「CC mtf & alerts 2.03 nmc」
 通貨強弱
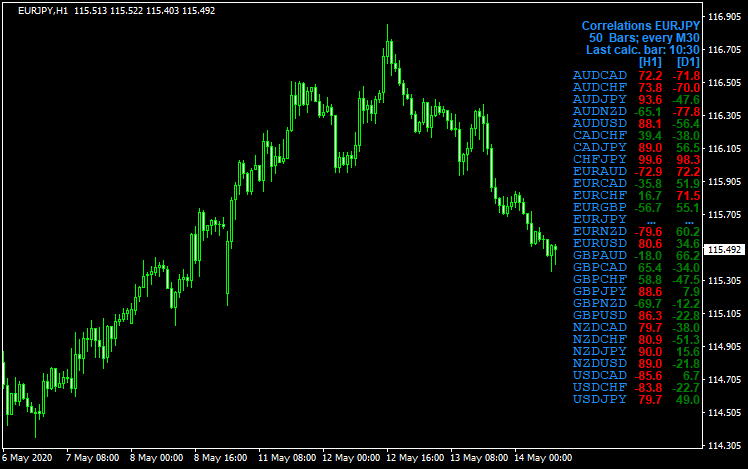
通貨強弱他の通貨ペアとの相関を一覧で表示する「smCorrelation MultiPairs」
 通貨強弱
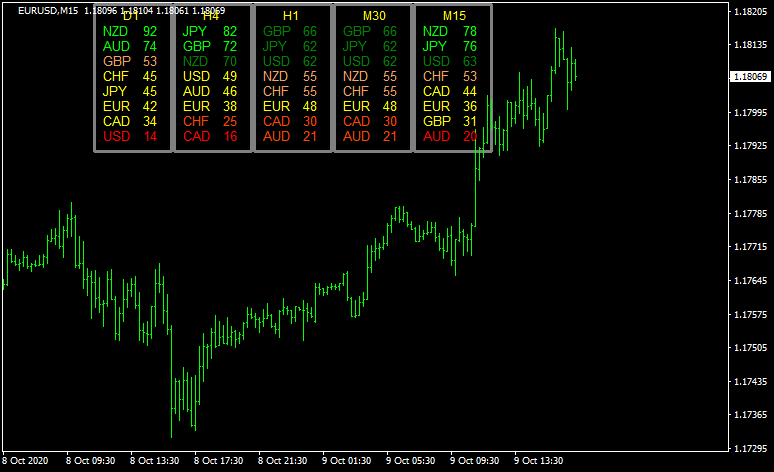
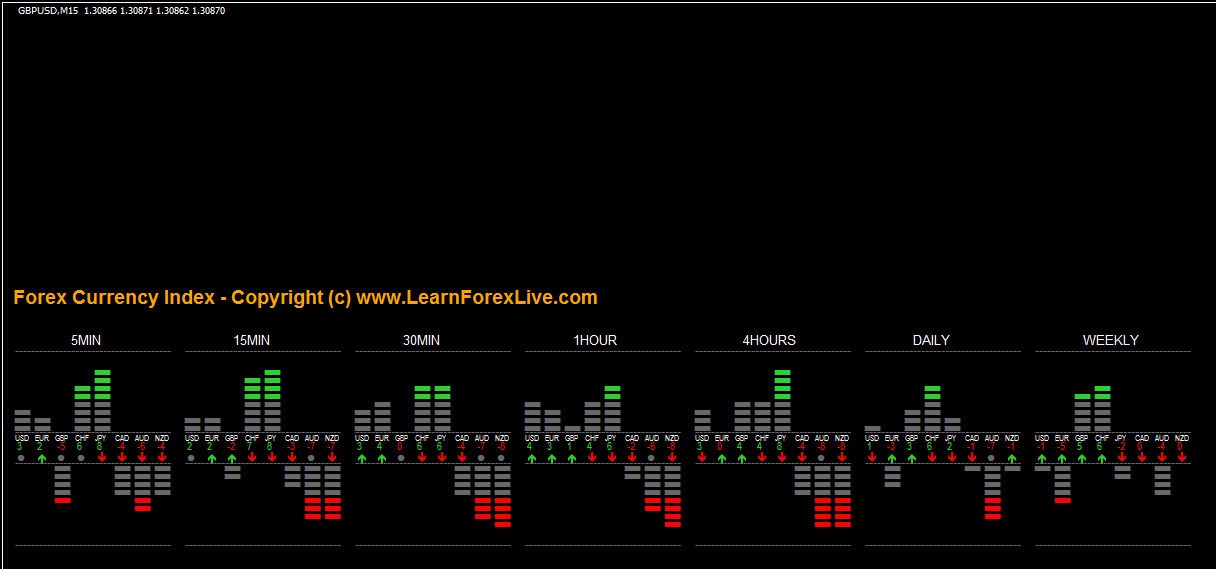
通貨強弱マルチタイムで通貨の強弱がわかる「ForexCurrencyIndex」
 通貨強弱
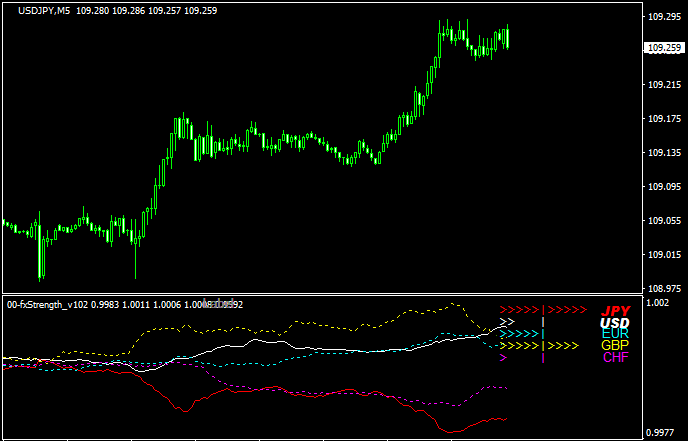
通貨強弱通貨の強弱の推移がグラフで表示される「00-fxStrength_v102」
 通貨強弱
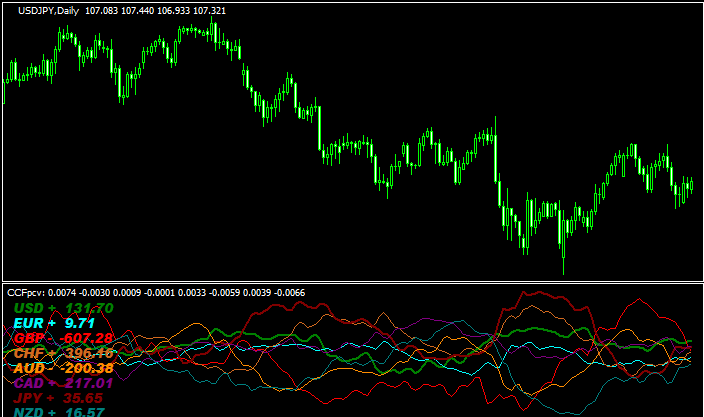
通貨強弱通貨の強弱の流れが分かる「CCFp_v1.0.2cvert」
 通貨強弱
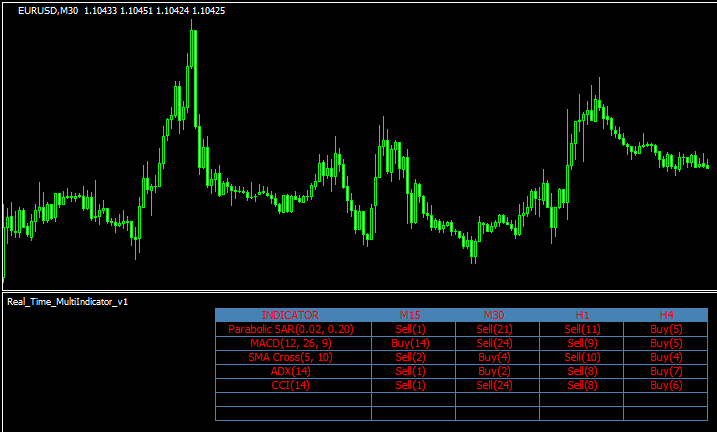
通貨強弱マルチタイムで複数の指標の状況が分かる「real-time-multiindicator」
 通貨強弱
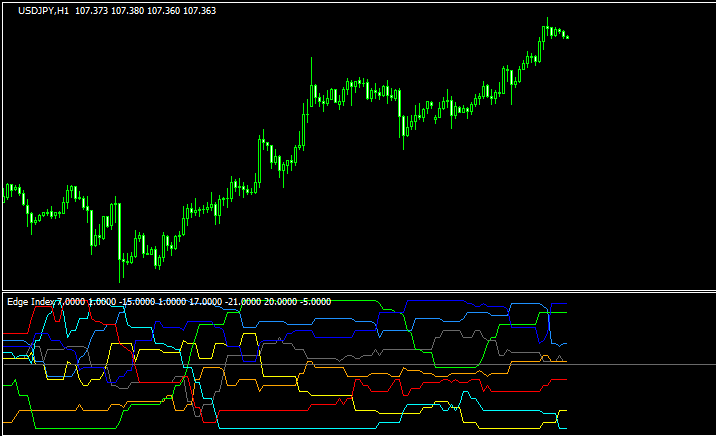
通貨強弱通貨の強弱の流れがグラフ化された「Edge_Index」
勝てる手法10個+超凄いインジをプレゼント!

\初心者から上級者まで大注目!/
当サイト限定で、XMの口座開設をすると「Forex Standard Club XM版」へ無料招待!
✔️ 期間限定で13,000円のボーナス!
✔️ 最大500ドルまで100%入金ボーナス!
✔️ 勝率を上げるトレード手法&限定インジケーターを多数提供!
将来の動きを予測する無料ツール差し上げます

未来予測インジケーター「Futuro FX」は、過去の動きと現在の動きの相関から少し先の動きを予測します。メルマガ登録で詳しい解説書をプレゼント!
さらにウォルフ波動を使ったトレード手法解説と本当に使えるウォルフ波動を認識するインジケーターもメルマガ内でご紹介します!
\初心者から上級者まで大注目!/
当サイト限定で、XMの口座開設をすると「Forex Standard Club XM版」へ無料招待!
✔️ 13,000円のボーナス!
✔️ 最大1000ドルまで100%入金ボーナス!
✔️ 勝率を上げるトレード手法&限定インジケーターを多数提供!