
 通貨強弱
通貨強弱通貨強弱
通貨強弱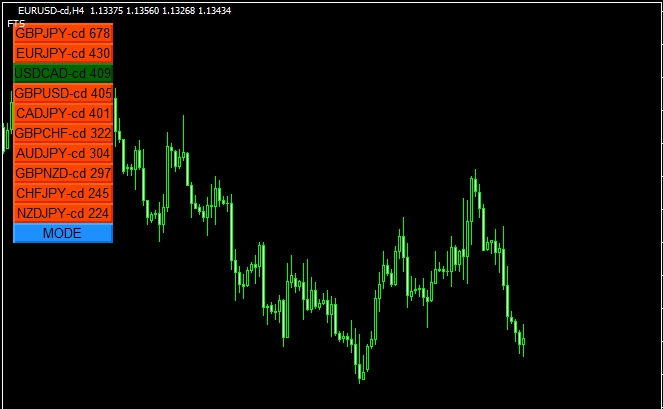 通貨強弱
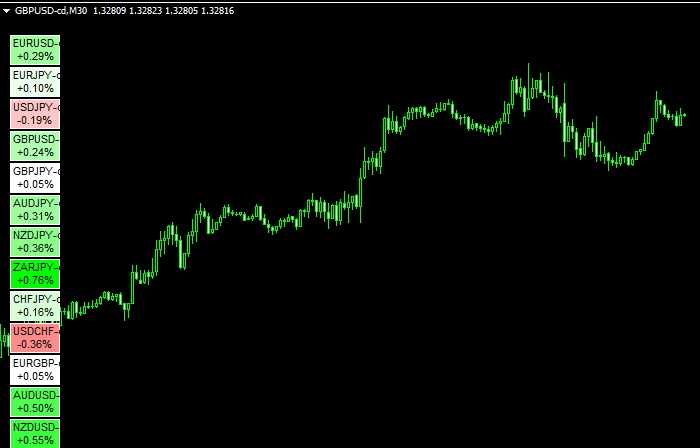
通貨強弱その日の始値からどれだけ動いたかを示す「updown」
 通貨強弱
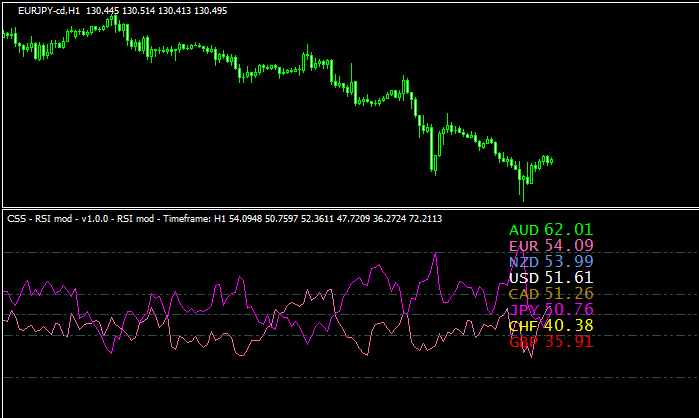
通貨強弱RSIから通貨の強さを導き出す「Currency Slope Strength_RSI_v1.4」
 通貨強弱
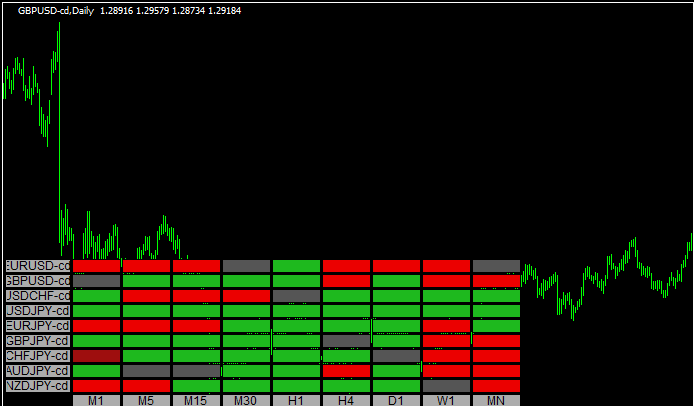
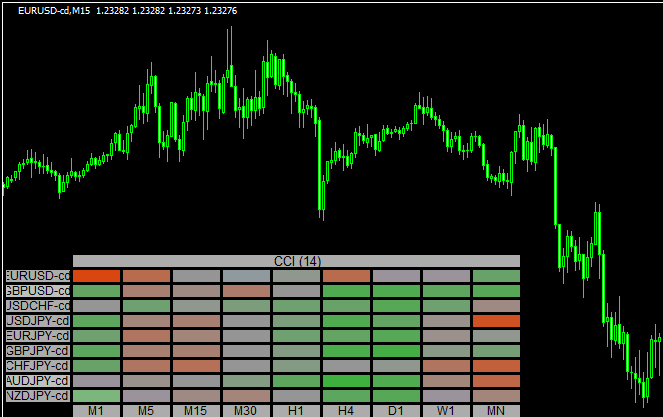
通貨強弱CCIによって各通貨ペアの強弱を時間軸ごとに示す「CCI heatmap」
 通貨強弱
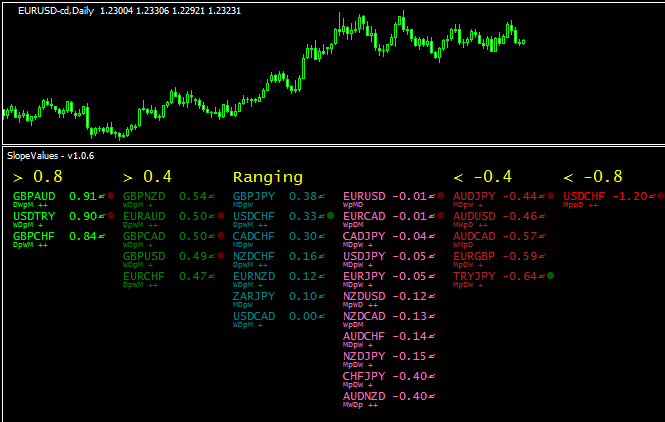
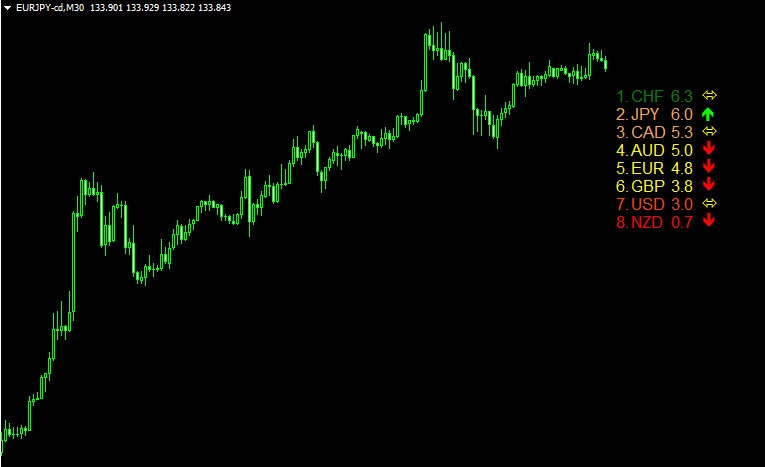
通貨強弱通貨ペアの強弱をチャート下にわかりやすく表示する「Currency-Pairs-Slope-Values-Indicator」
 通貨強弱
通貨強弱為替市場全体を監視するための「MADdash」
 通貨強弱
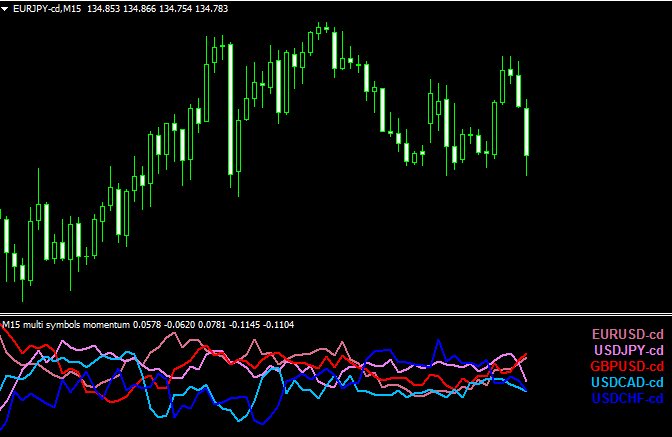
通貨強弱複数の通貨ペアのモーメンタムをグラフ化した「Multi symbols momentum mtf nmc」
 通貨強弱
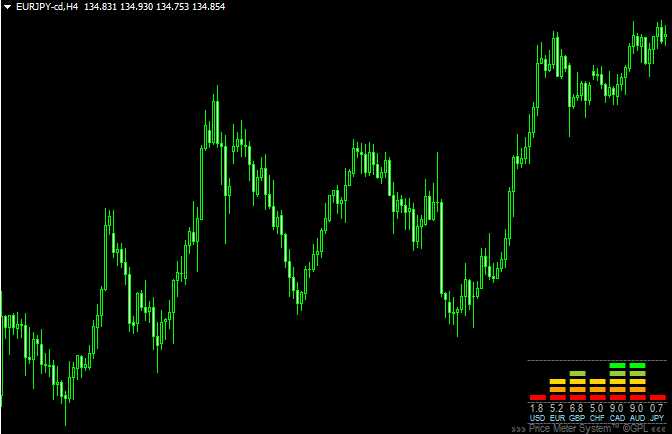
通貨強弱チャートの右下に通貨の強弱関係を見やすく表示「ixMeter MultiPair Indicator」
 通貨強弱
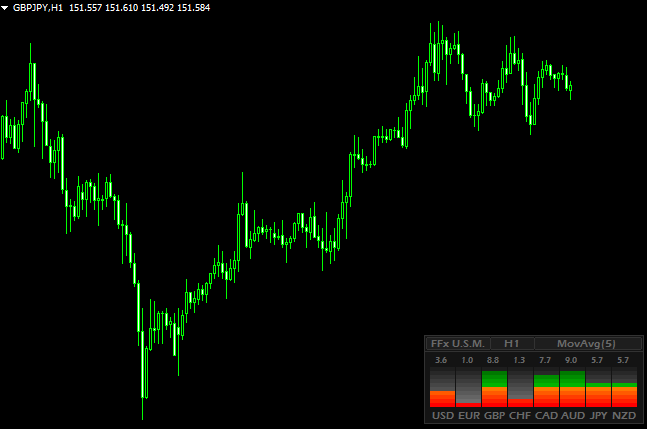
通貨強弱通貨の強弱の設定を任意で変更できる「FFx-Universal-Strength-Meter-Indicator」
 通貨強弱
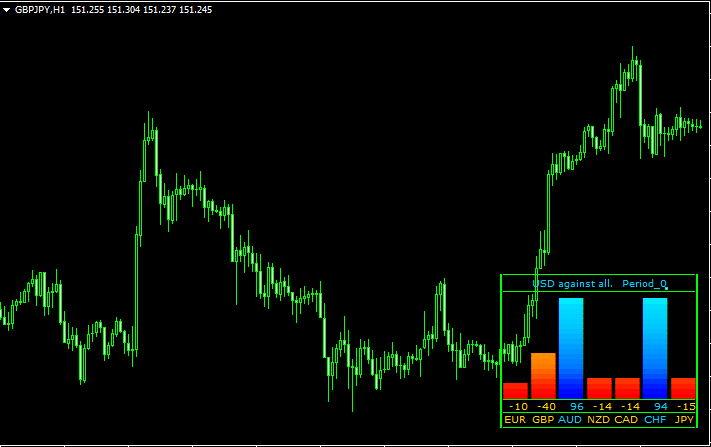
通貨強弱米ドルとの強さを比較して表示「USD against all」
 通貨強弱
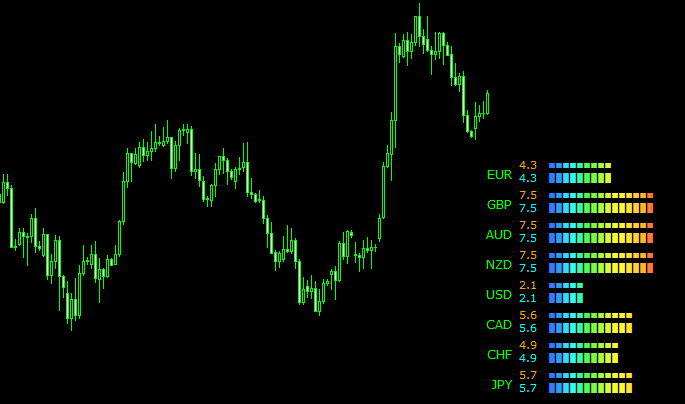
通貨強弱通貨ペアの強弱を色分けして表示「HeatMap-Gradient-Scale」
 通貨強弱
通貨強弱通貨の強弱を見やすく表示する「CurrencyPowerMeter」
 通貨強弱
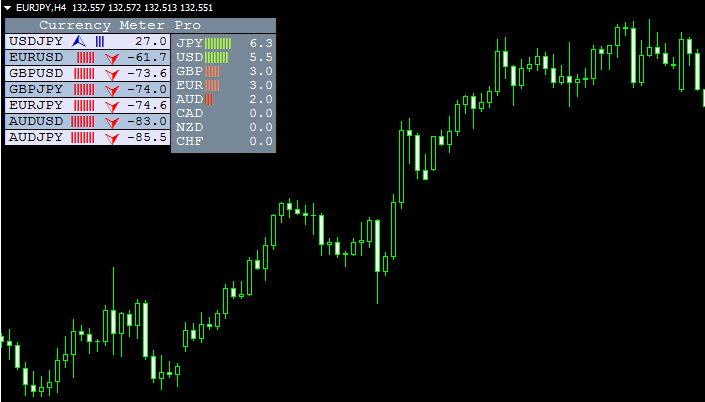
通貨強弱通貨の強弱及び通貨ペアのトレンドを見やすく表示「currency-meter-indicator」
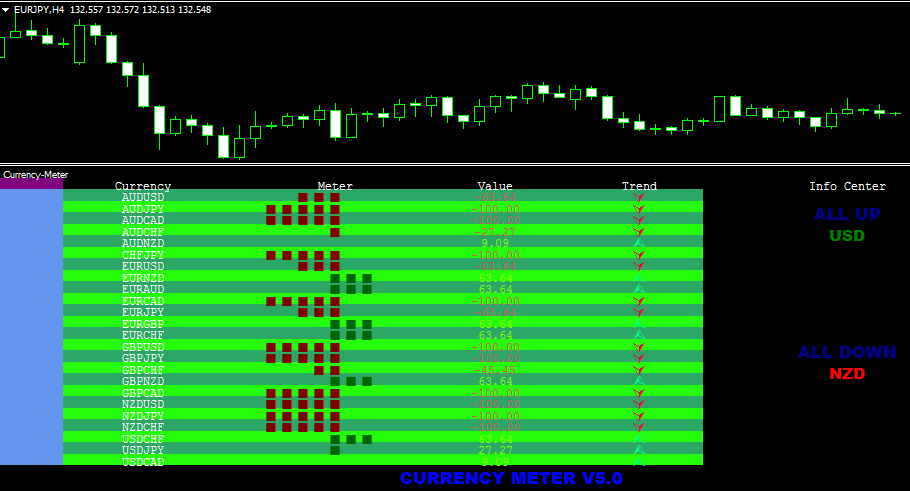 通貨強弱
通貨強弱通貨ペアの強弱を表で示す「currency-meter」
 通貨強弱
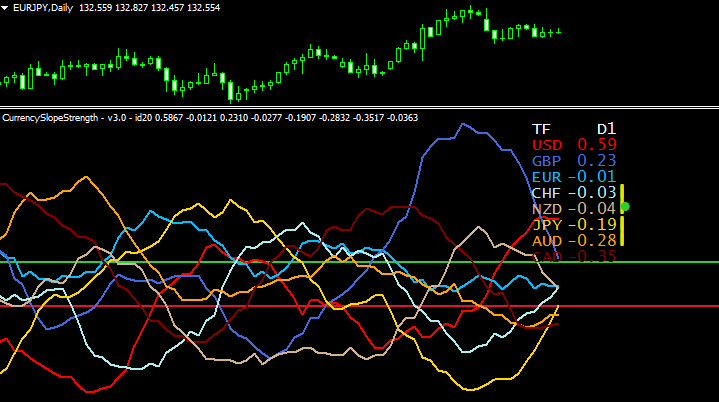
通貨強弱通貨の強弱がグラフで分かる「currency-slope-strength」
 通貨強弱
通貨強弱通貨の強弱が一目で分かる「CM_Strength」
勝てる手法10個+超凄いインジをプレゼント!

\初心者から上級者まで大注目!/
当サイト限定で、XMの口座開設をすると「Forex Standard Club XM版」へ無料招待!
✔️ 期間限定で13,000円のボーナス!
✔️ 最大500ドルまで100%入金ボーナス!
✔️ 勝率を上げるトレード手法&限定インジケーターを多数提供!
将来の動きを予測する無料ツール差し上げます

未来予測インジケーター「Futuro FX」は、過去の動きと現在の動きの相関から少し先の動きを予測します。メルマガ登録で詳しい解説書をプレゼント!
さらにスマートマネーコンセプト(SMC)について解説したPDFもプレゼント!
\初心者から上級者まで大注目!/
当サイト限定で、XMの口座開設をすると「Forex Standard Club XM版」へ無料招待!
✔️ 13,000円のボーナス!
✔️ 最大1000ドルまで100%入金ボーナス!
✔️ 勝率を上げるトレード手法&限定インジケーターを多数提供!