
 オシレーター
サブチャート
オシレーター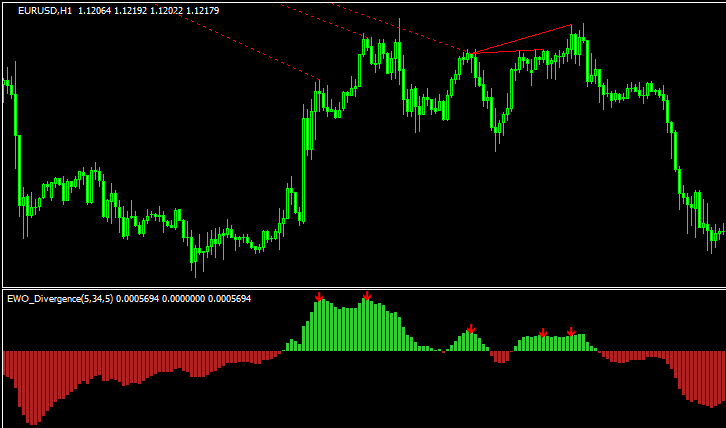 オシレーター
ダイバージェンスを検知する「Ewo Divergence Indicator」
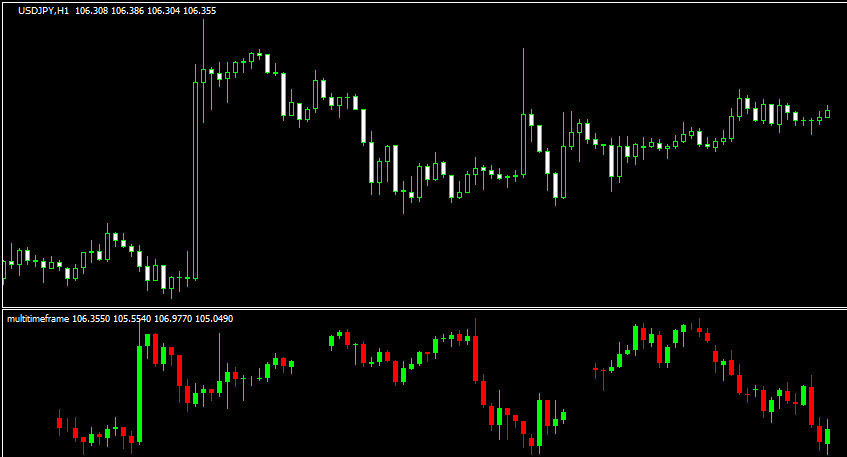 その他
その他マルチタイムでローソク足の状況が確認できる「multitimeframe」
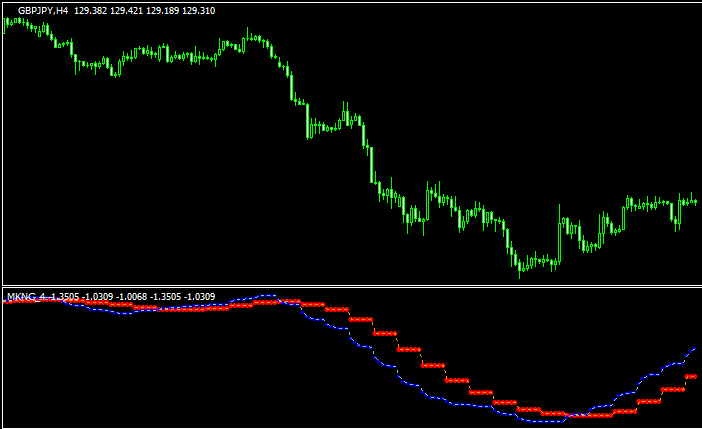
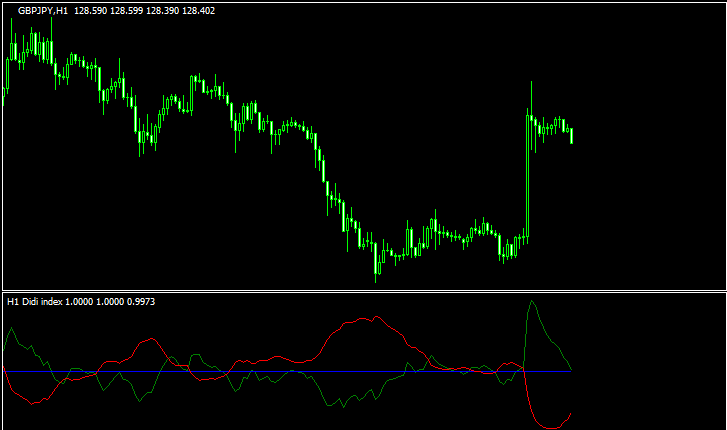 オシレーター
3本のMAの位置関係をオシレーターとして示す「Didi_index_mtf+alerts+lines nmc」
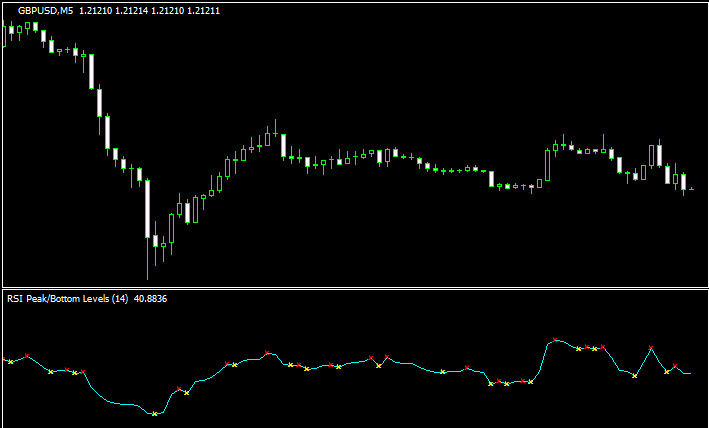 オシレーター
RSIの向きが変わるとドットが点灯する「RSI_Peak_and_Bottom」
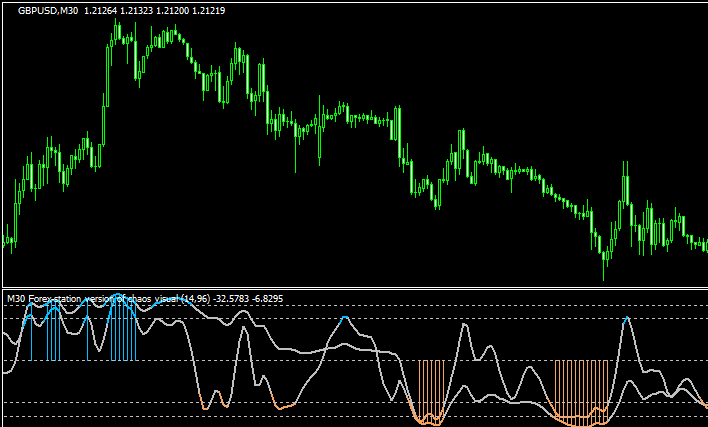 オシレーター
相場の反転ポイントを分かりやすく示す「Chaos Visual averages 1.43」
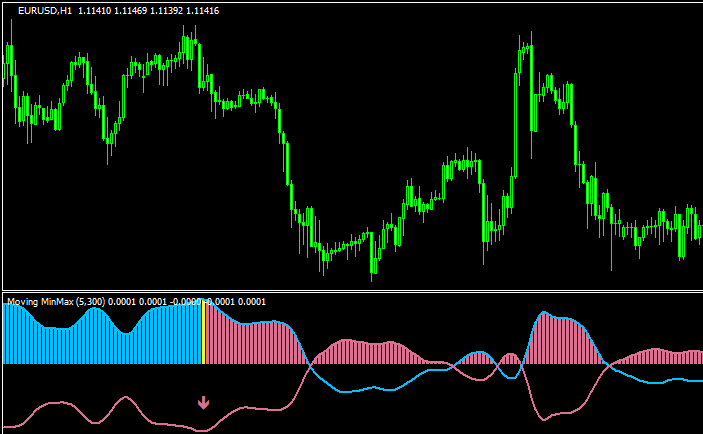 オシレーター
MACDのようでちょっと違う「moving-minmax-indicator」
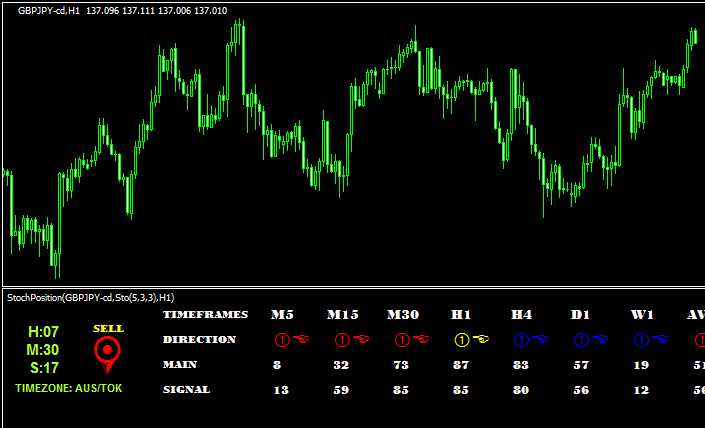 相場状況表示
マルチタイムでストキャスティクスの状況を示す「stochposition」
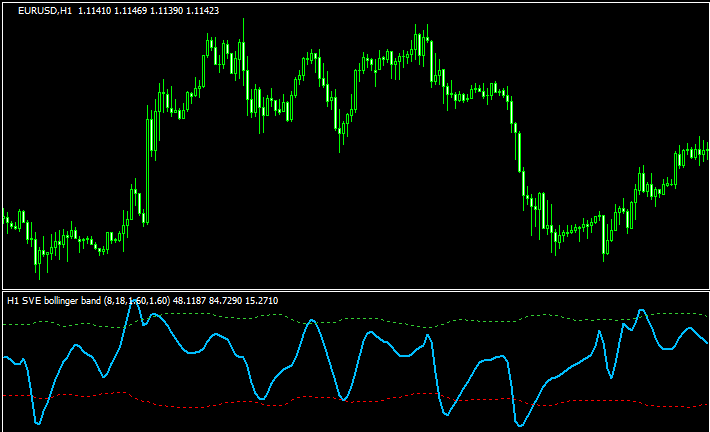 オシレーター
オシレーターにボリバンが表示される「sve bollinger band mtf + alerts」
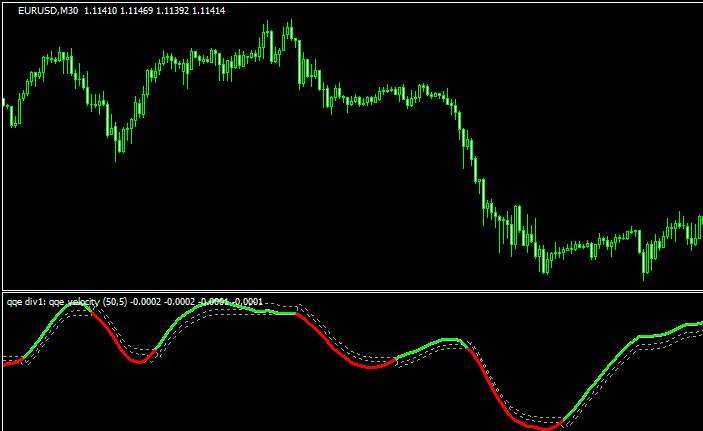 オシレーター
QQEをベースとしたインジ「QQE parabolic velocity new (arrows + alerts + divergence)」
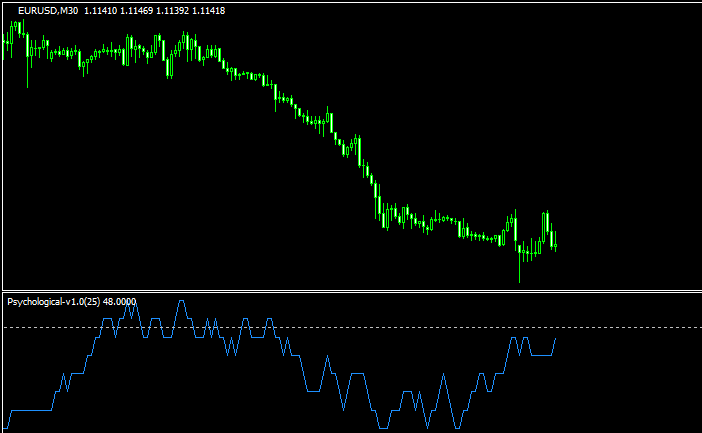 オシレーター
サイコロジカルラインを表示する「psychological-indicator」
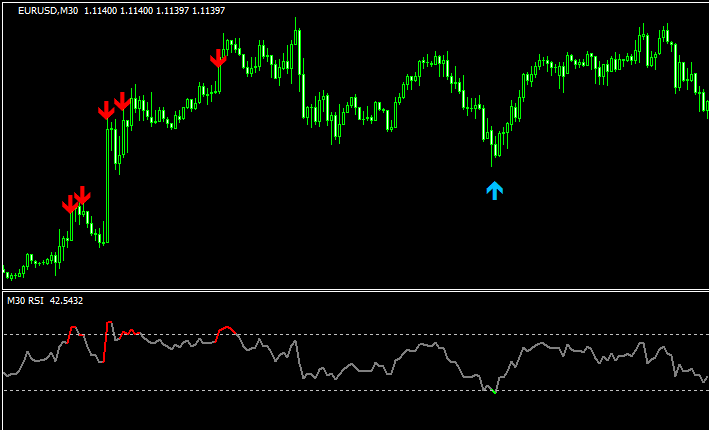 オシレーター
RSIの上限や下限でサインが出る「RSI – alerts – 2_1」
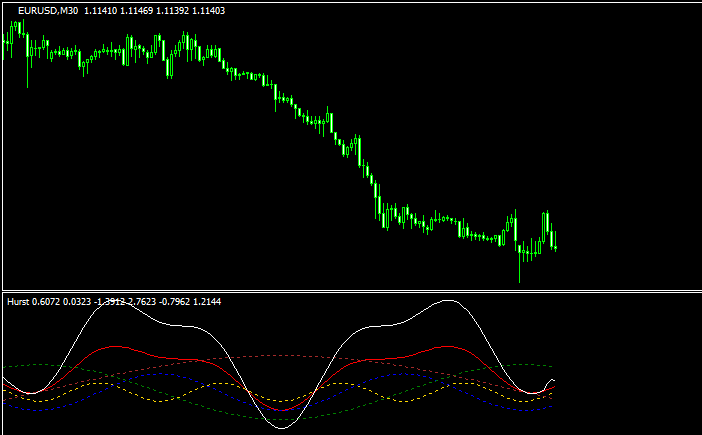 オシレーター
市場のサイクルを示す「hurst-indicator」
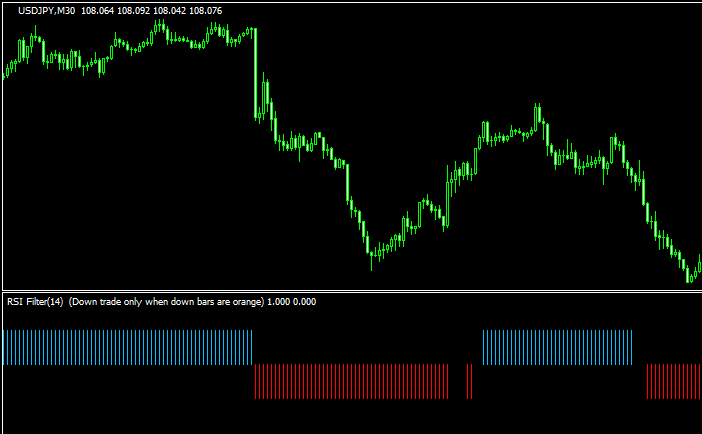 バータイプ
バータイプ大まかなトレンド方向を示す「Flat_Trend_RSI」
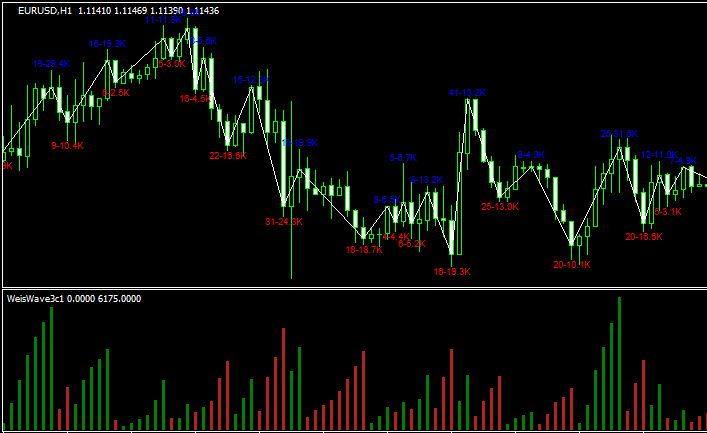 Volume
ボリュームをベースとした「WeisWave3c1」
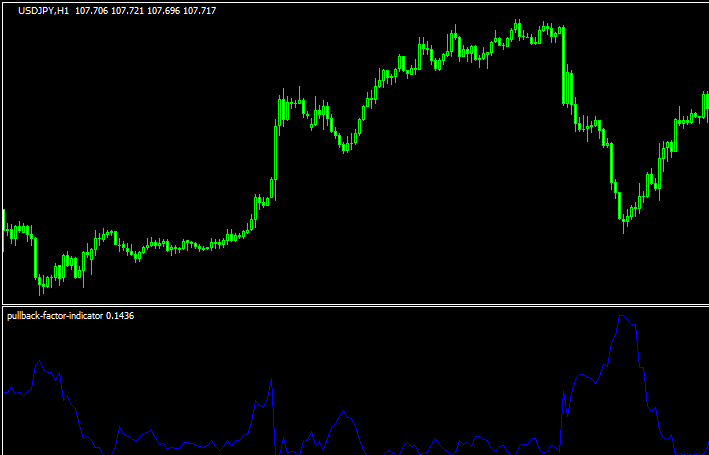 オシレーター
押し目や戻りの参考になる「pullback-factor-indicator」
勝てる手法10個+超凄いインジをプレゼント!

\初心者から上級者まで大注目!/
当サイト限定で、XMの口座開設をすると「Forex Standard Club XM版」へ無料招待!
✔️ 期間限定で13,000円のボーナス!
✔️ 最大500ドルまで100%入金ボーナス!
✔️ 勝率を上げるトレード手法&限定インジケーターを多数提供!
将来の動きを予測する無料ツール差し上げます

未来予測インジケーター「Futuro FX」は、過去の動きと現在の動きの相関から少し先の動きを予測します。メルマガ登録で詳しい解説書をプレゼント!
さらにスマートマネーコンセプト(SMC)について解説したPDFもプレゼント!
\初心者から上級者まで大注目!/
当サイト限定で、XMの口座開設をすると「Forex Standard Club XM版」へ無料招待!
✔️ 13,000円のボーナス!
✔️ 最大1000ドルまで100%入金ボーナス!
✔️ 勝率を上げるトレード手法&限定インジケーターを多数提供!