
 オシレーター
サブチャート
オシレーター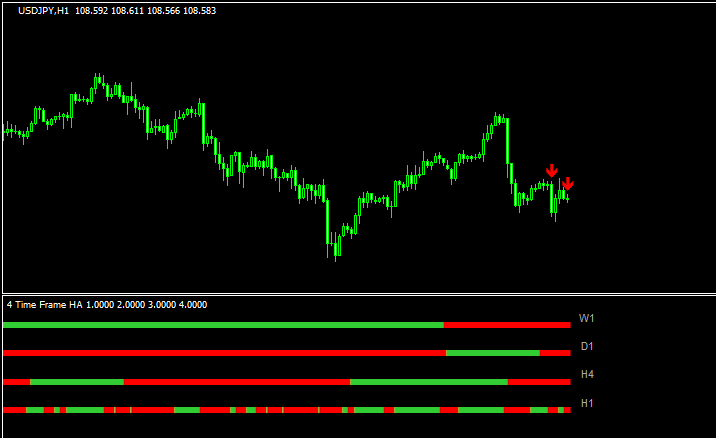 相場状況表示
4つの時間足で平均足の方向が分かり、揃うとシグナルも出る「4 TF Heiken Ashi Arrows」
 オシレーター
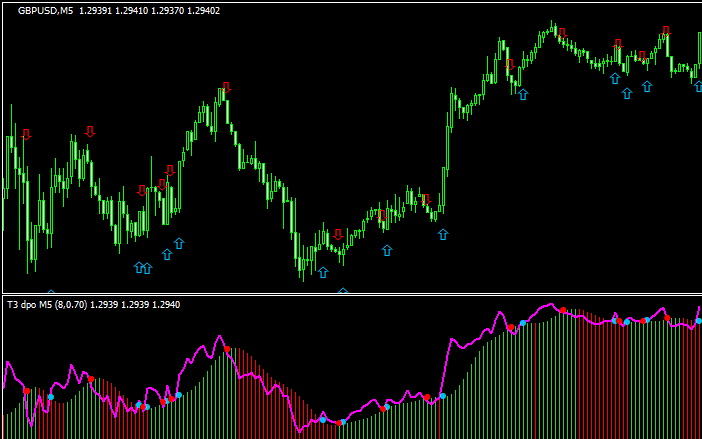
T3dDPO v2 colored + arrows
 オシレーター
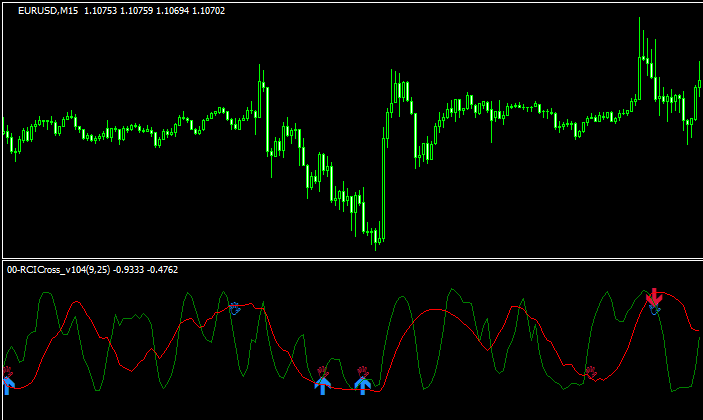
RCIのクロスでサインを出す「00-RCICross_v104」
 相場状況表示
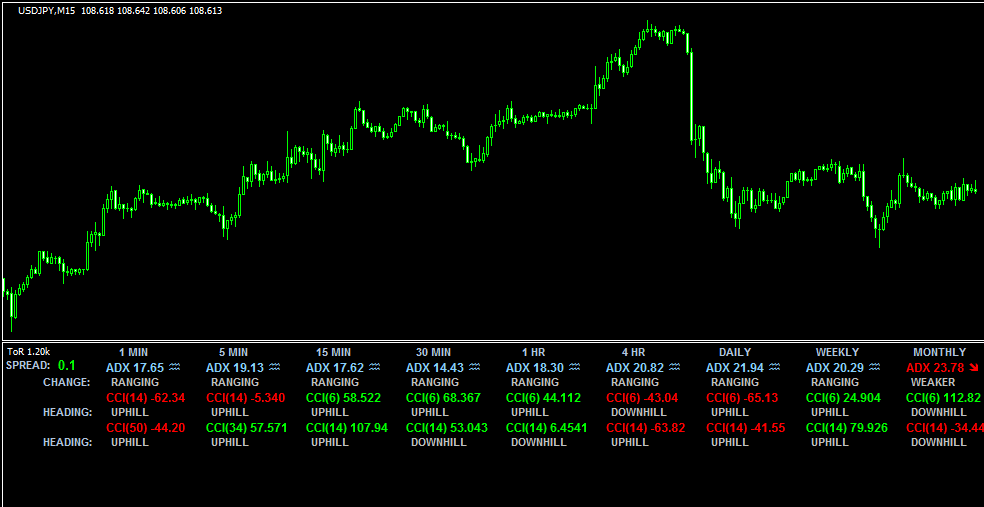
マルチタイムでADXとCCIの状況が分かる「ToR_1.20k」
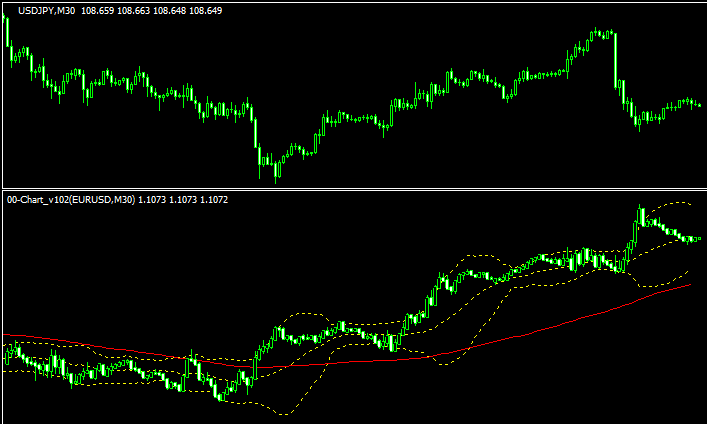 その他
その他他の通貨ペアのチャートをサブチャートに表示する「00-Chart_v102」
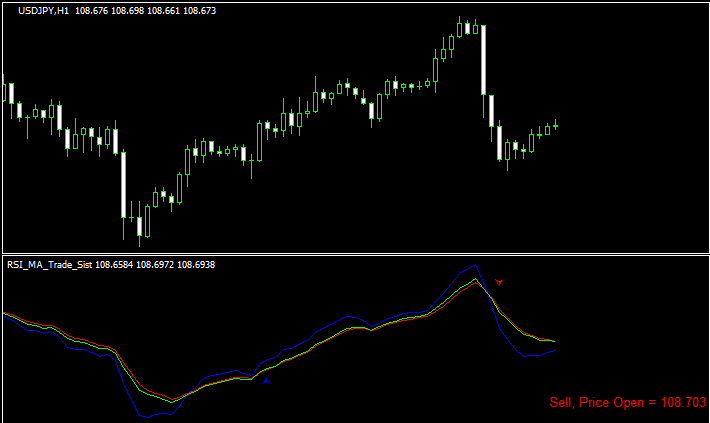 オシレーター
RSIとEMAでサインの出現する「rsi_ma_trade_sist」
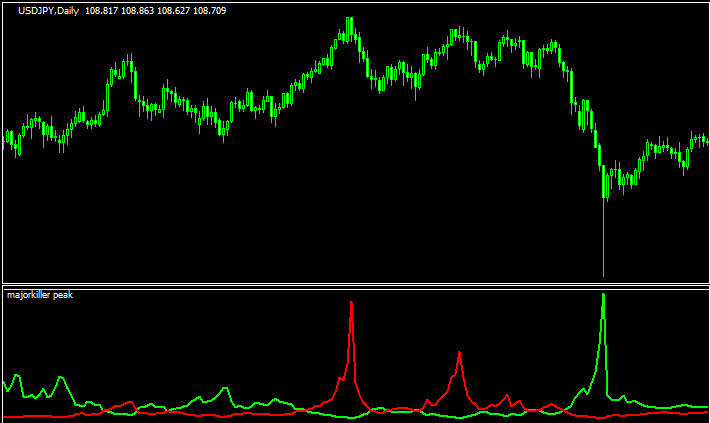 オシレーター
相場の天と底が見えやすくなる?「majorkiller peak」
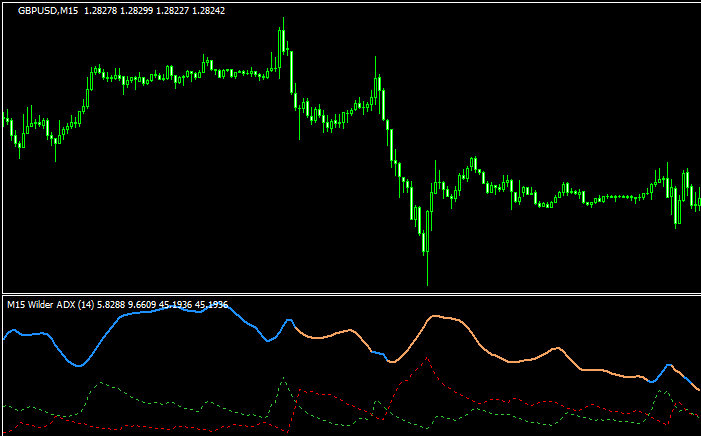 オシレーター
スムーズド化したADXをマルチタイムで表示する「wilders adx mtf」
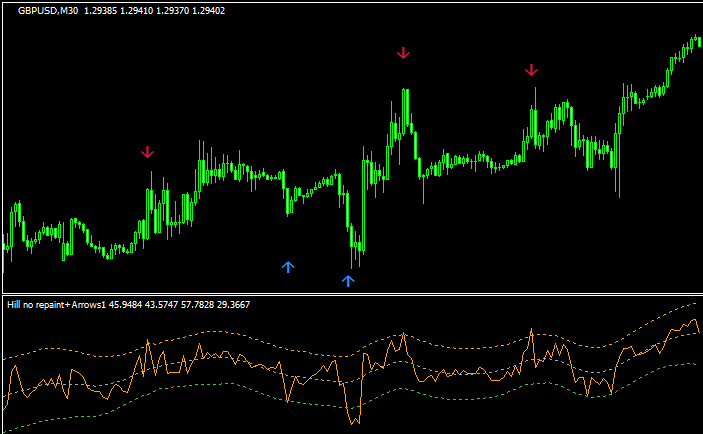 オシレーター
RSIに標準偏差バンドの表示される「Hill no repaint+Arrows1」
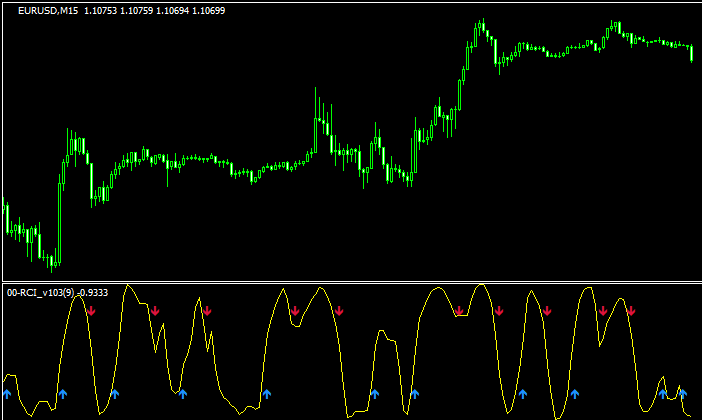 オシレーター
RCIからの逆張りサインが出る「00-RCI_v104」
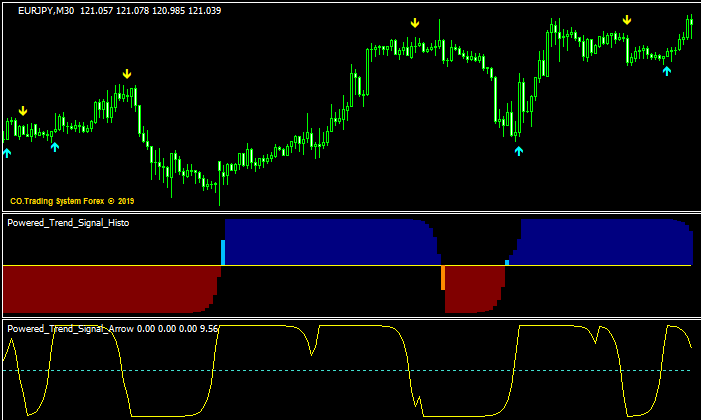 オシレーター
2つのインジを使ったトレードシステム「Powered_Trend_Signal_Arrow_Alert」
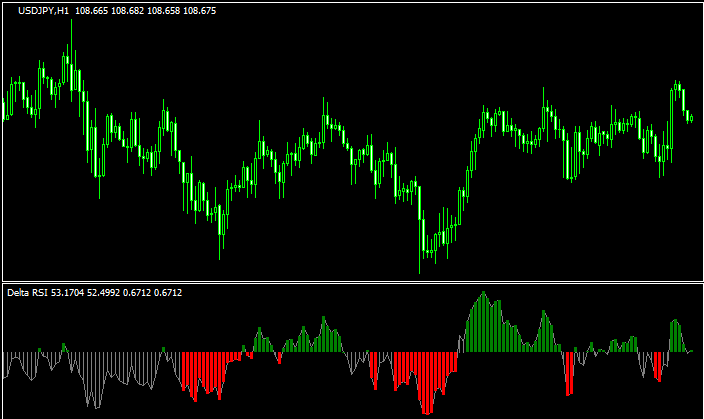 オシレーター
2つのRSIのクロスと乖離を見る「Delta_RSI」
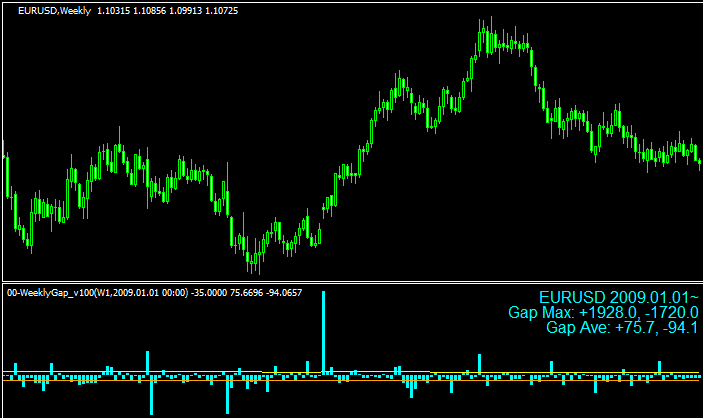 オシレーター
窓の開きが視覚的に分かりやすい「00-WeeklyGap_v100」
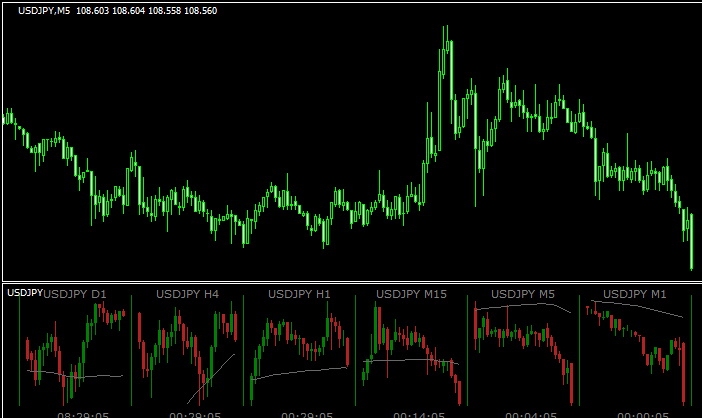 その他
その他チャート下に他の時間足のチャートが表示出来る「pipware-charts-v6.2」
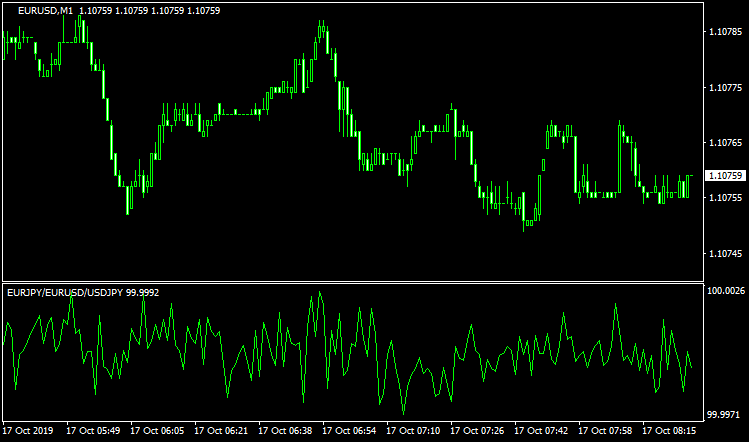 その他
その他三角アービトラージのチャンスを検証できる「00-Arbitrage」
勝てる手法10個+超凄いインジをプレゼント!

\初心者から上級者まで大注目!/
当サイト限定で、XMの口座開設をすると「Forex Standard Club XM版」へ無料招待!
✔️ 期間限定で13,000円のボーナス!
✔️ 最大500ドルまで100%入金ボーナス!
✔️ 勝率を上げるトレード手法&限定インジケーターを多数提供!
将来の動きを予測する無料ツール差し上げます

未来予測インジケーター「Futuro FX」は、過去の動きと現在の動きの相関から少し先の動きを予測します。メルマガ登録で詳しい解説書をプレゼント!
さらにスマートマネーコンセプト(SMC)について解説したPDFもプレゼント!
\初心者から上級者まで大注目!/
当サイト限定で、XMの口座開設をすると「Forex Standard Club XM版」へ無料招待!
✔️ 13,000円のボーナス!
✔️ 最大1000ドルまで100%入金ボーナス!
✔️ 勝率を上げるトレード手法&限定インジケーターを多数提供!