 オシレーター
サブチャート
 オシレーター
 オシレーター
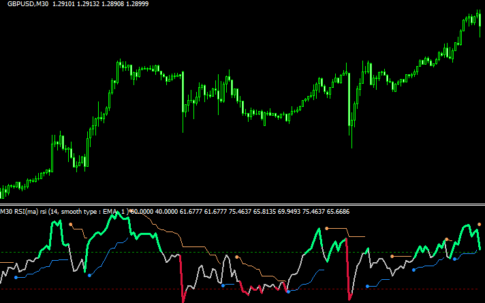
RSIに複数のバンドを追加してサインも出る「xRsi(+ma + bands + mtf)」
 オシレーター
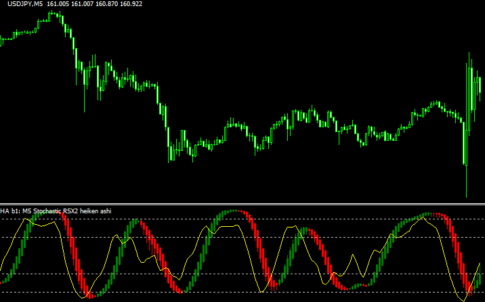
ストキャスティクスRSIを表示してダイバージェンスも認識する「! stoch rsi ha avgs – smoothed (mtf + sw + alerts + divergence)」
 オシレーター
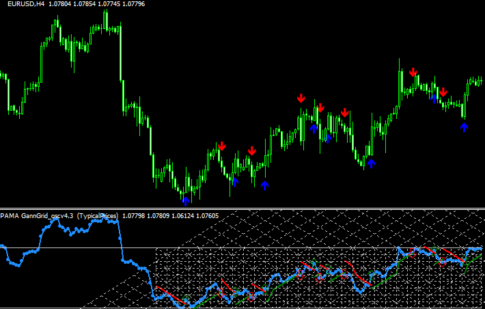
波の切り替わりでサインが出るオシレーター「PAMA GannGrid_oscv4.3 Alert」
 オシレーター
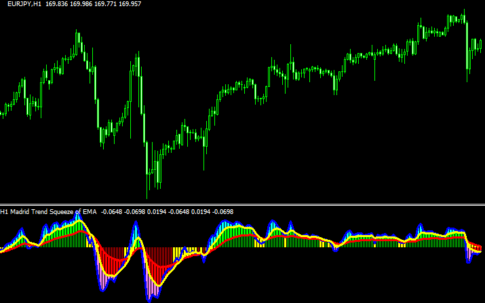
相場のスクイーズやトレンド方向が客観的に分かる「! Madrid trend squeeze – avgs (mtf) 」
 オシレーター
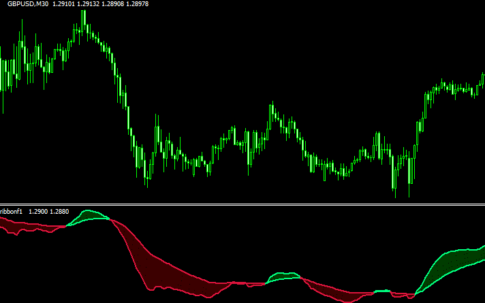
サブチャートにリボンを表示する「ribbon(+sw)」
 オシレーター
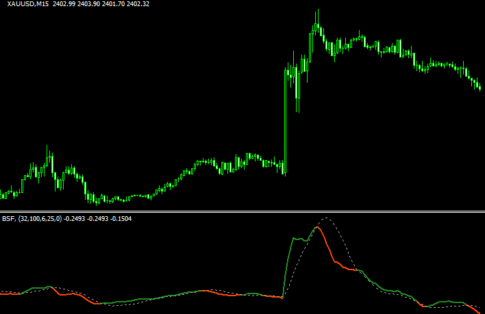
トレンドの勢いが出ているポイントが分かりやすい「Behgozin Strength Finder + alerts 2 lines」
 オシレーター
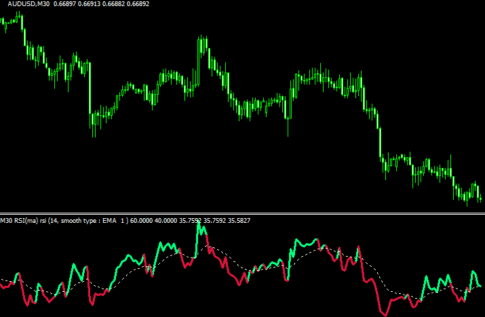
RSIについて様々な条件でサインを出せる「xRsi(+ma) 1.3」
 オシレーター
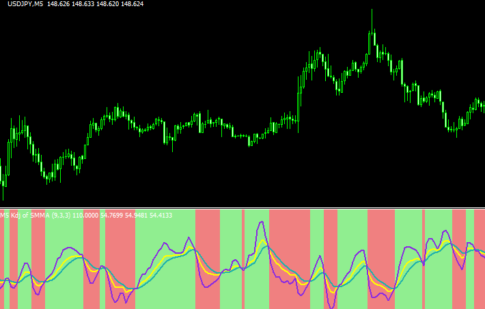
ストキャスから派生したオシレーター「KDJ + histo avgs (mtf + alerts)」
![88 Filter AA LV [Vertex NRP]のチャート画像](https://technical-indicators.com/wp-content/uploads/2024/07/88-485x314.png) オシレーター
オシレータートレンド反転でサインを出す「88 Filter AA LV [Vertex NRP]」
 オシレーター
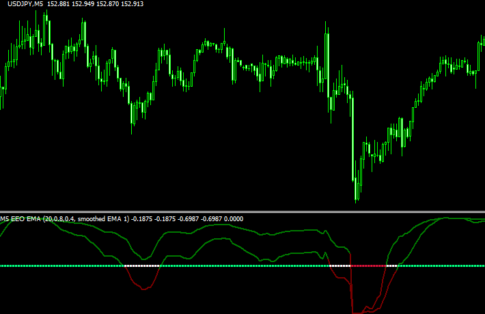
2本のオシレーターとサインを出す「Ehlers Early Onset smoothed(+ trend histo)」
 オシレーター
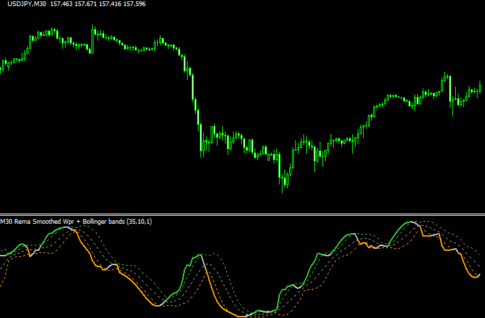
スムーズド化したWPRにボリバンを追加した「! smoothed wpr with bollinger bands (filtered + mtf + alerts)」
 オシレーター
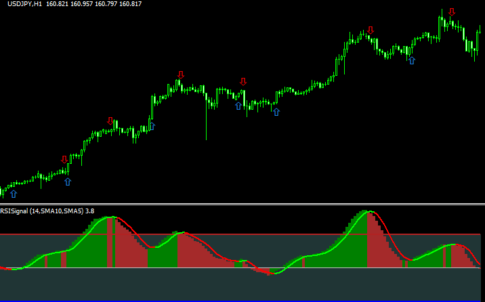
3本のRSIを利用してサインを出す「RSISignal_new 1.1」
 オシレーター
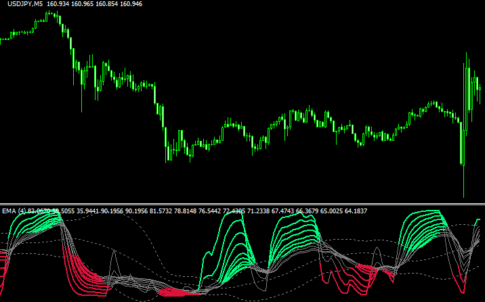
10本のRMIを表示する「TDI(wRMI x10)」
 オシレーター
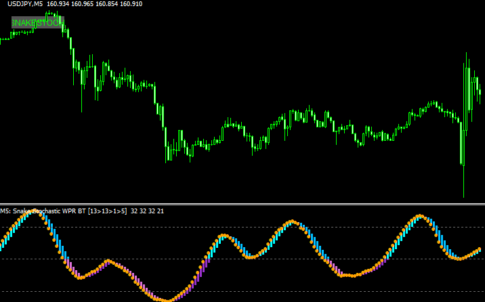
蛇のような滑らかに相場の波を示す「Snake Stochastic WPR BT」
 オシレーター

