
![88 Filter AA LV [Vertex NRP]のチャート画像](https://technical-indicators.com/wp-content/uploads/2024/07/88-485x314.png) オシレーター
オシレーターサブチャート
オシレーター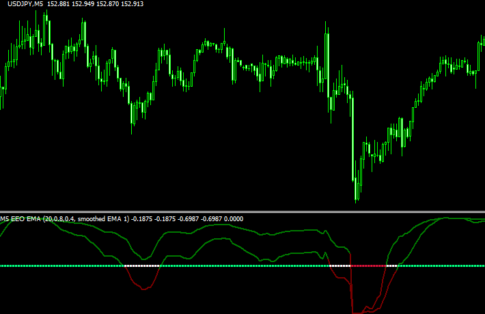 オシレーター
2本のオシレーターとサインを出す「Ehlers Early Onset smoothed(+ trend histo)」
 オシレーター
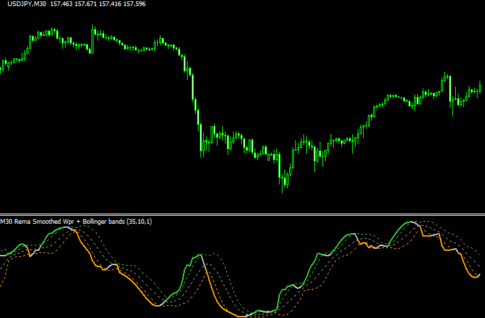
スムーズド化したWPRにボリバンを追加した「! smoothed wpr with bollinger bands (filtered + mtf + alerts)」
 オシレーター
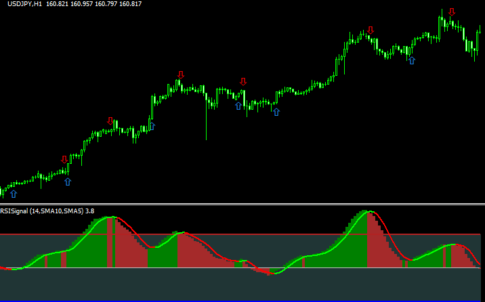
3本のRSIを利用してサインを出す「RSISignal_new 1.1」
 オシレーター
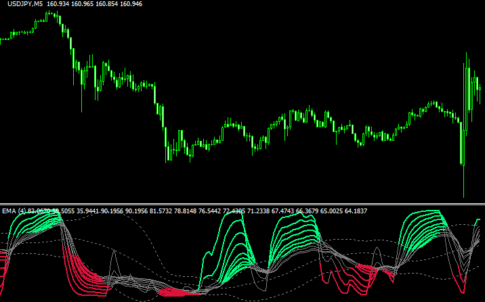
10本のRMIを表示する「TDI(wRMI x10)」
 オシレーター
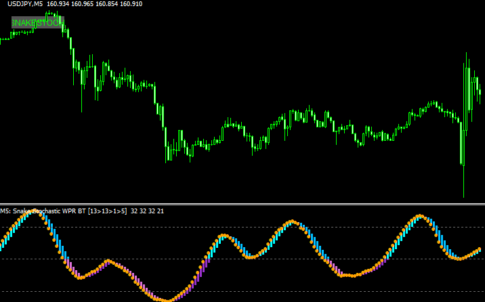
蛇のような滑らかに相場の波を示す「Snake Stochastic WPR BT」
 オシレーター
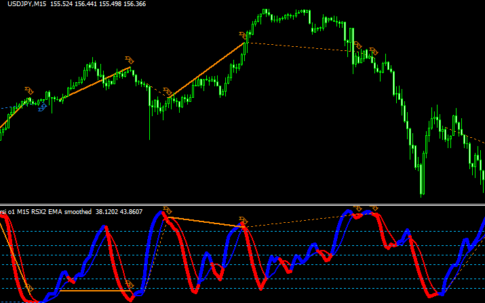
指定した値に到達してダイバージェンスが生じたらサインが出るRSI「! rsima (mtf + divergence)」
 オシレーター
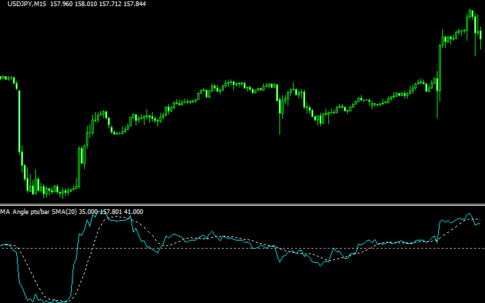
移動平均線の角度をオシレーターとして示す「MA_Angle_ptsPerBar_or_Degree」
 オシレーター
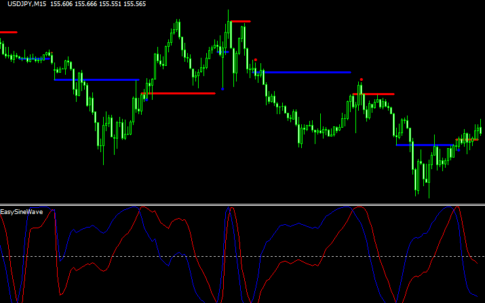
サポレジラインを示すオシレーター「EasySineWave」
 オシレーター
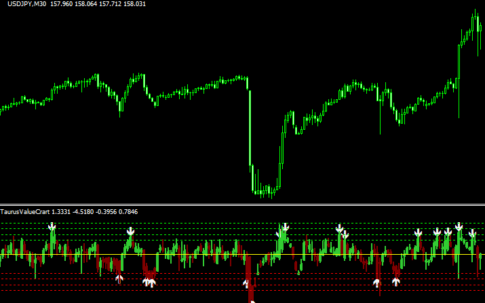
相場が行き過ぎたところでサインが出る「TaurusValueCrart」
 オシレーター
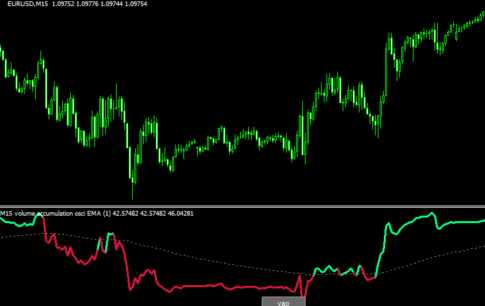
ボリュームをベースにしてトレンド方向が分かる「volume accumulation oscillator (mtf + BT)」
 オシレーター
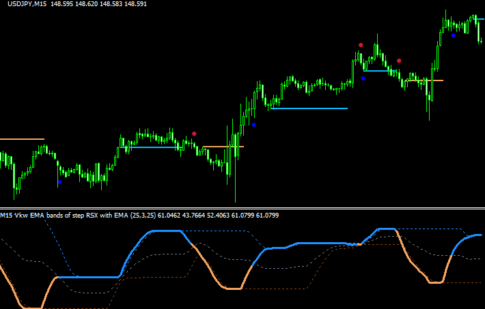
RSXをベースにバンドとラインを表示する「! vkw bands avgs (mtf + alert + arrows + sr)」
 オシレーター
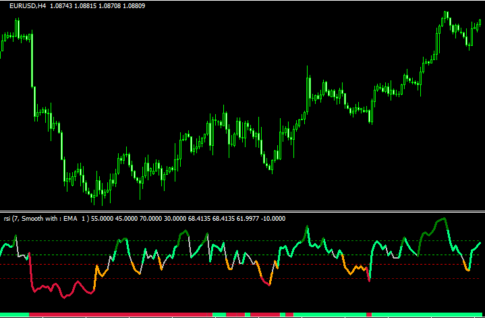
RSIでサインを出し、移動平均線でフィルタリングできる「rsi (2xlevels + filter ma)」
 オシレーター
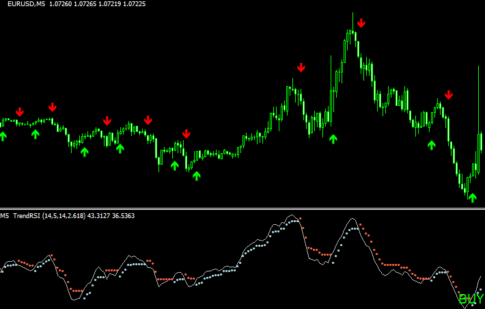
RSIをベースとしてトレンド方向のサインを出す「TrendRSI_v3.03 mtf &alerts &arrows &text」
 オシレーター
RSIトレンドラインを表示してブレイクしたらサインを出す「RSI_Trendlines」
 オシレーター
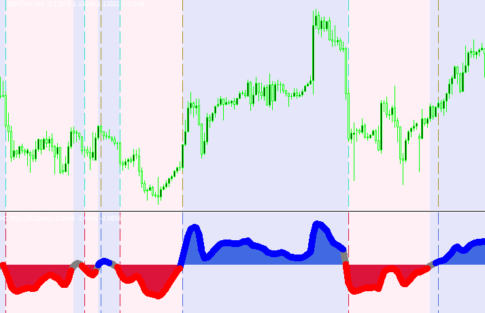
RSIスムーズドでトレンド方向を示す「rsi – smoothed – mtf + alerts + lines + zones」
勝てる手法10個+超凄いインジをプレゼント!

\初心者から上級者まで大注目!/
当サイト限定で、XMの口座開設をすると「Forex Standard Club XM版」へ無料招待!
✔️ 期間限定で13,000円のボーナス!
✔️ 最大500ドルまで100%入金ボーナス!
✔️ 勝率を上げるトレード手法&限定インジケーターを多数提供!
将来の動きを予測する無料ツール差し上げます

未来予測インジケーター「Futuro FX」は、過去の動きと現在の動きの相関から少し先の動きを予測します。メルマガ登録で詳しい解説書をプレゼント!
さらにスマートマネーコンセプト(SMC)について解説したPDFもプレゼント!
\初心者から上級者まで大注目!/
当サイト限定で、XMの口座開設をすると「Forex Standard Club XM版」へ無料招待!
✔️ 13,000円のボーナス!
✔️ 最大1000ドルまで100%入金ボーナス!
✔️ 勝率を上げるトレード手法&限定インジケーターを多数提供!