
 平均足
平均足○○足
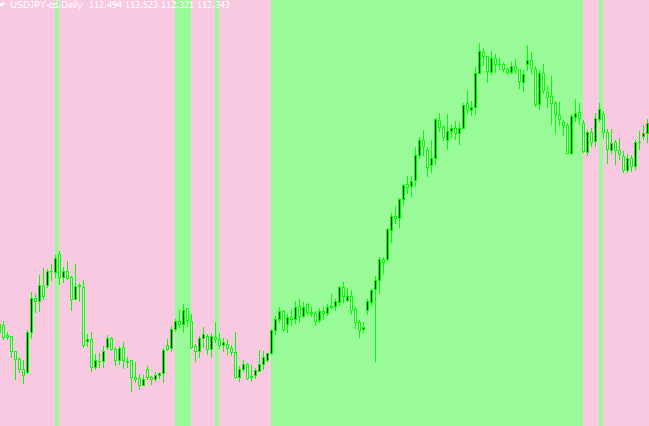
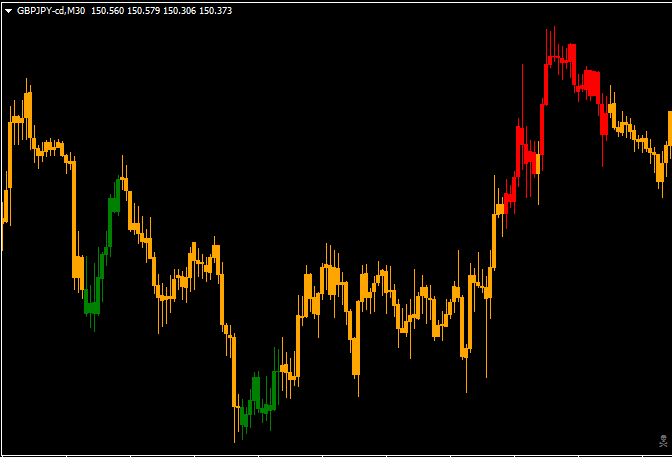
平均足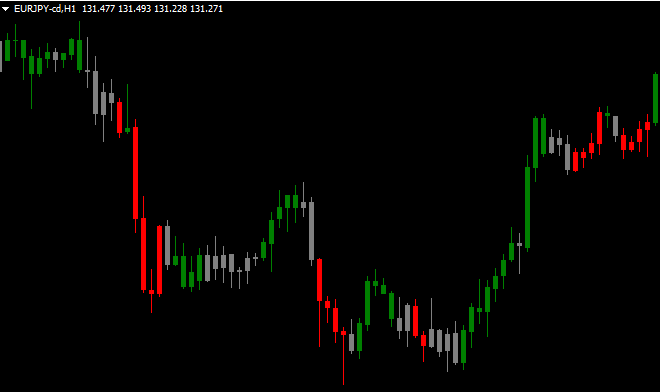 トレンド表示型
上昇トレンド、下降トレンド、レンジ、でローソク足の色を変化させる「ZoneTrade_v2.4」
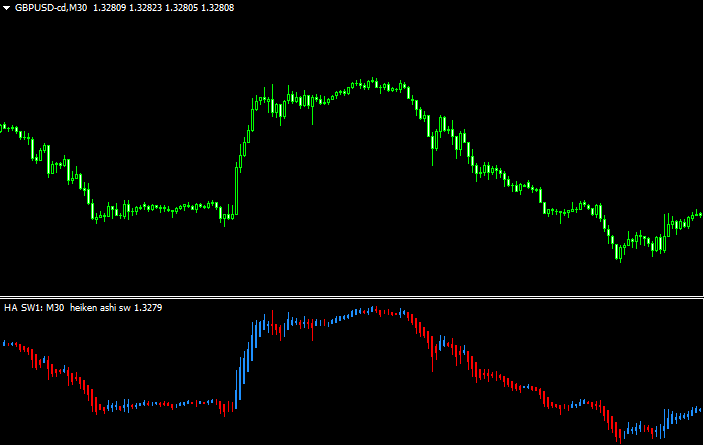 平均足
平均足チャート下にマルチタイムも可能な平均足を表示する「Heiken AshiH_sw_mtf+alerts nmc」
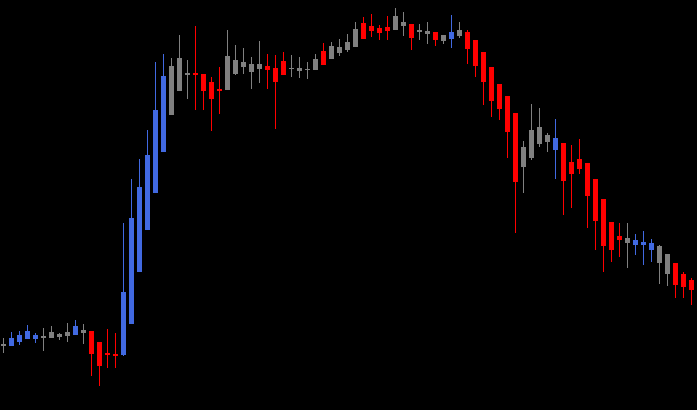
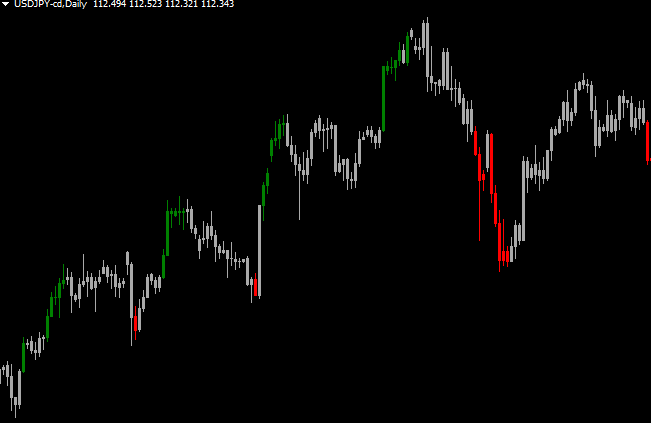
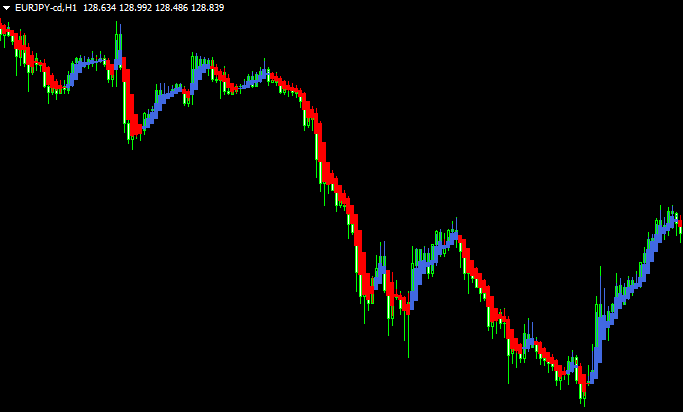
 トレンド表示型
スーパートレンドをローソク足に反映「A Nrp SuperTrend Candles_mtf+alerts 2.01 – Text」
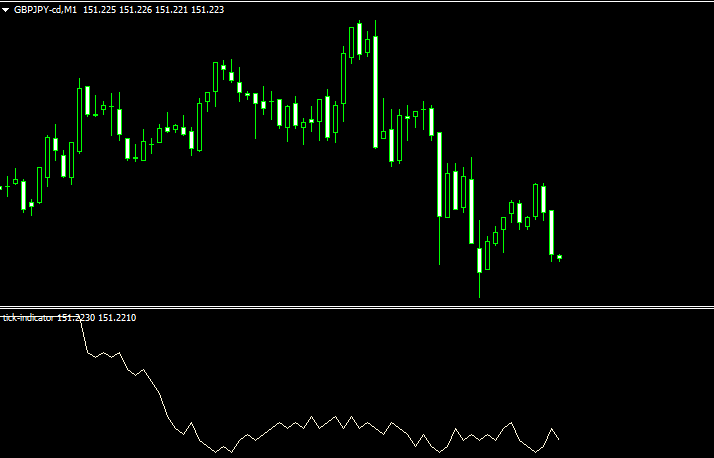 ティック
ティックチャート下にティックチャートを表示する「tick-indicator」
 トレンド表示型
CCIがゼロラインを超えると色が変わる「CCI zones」
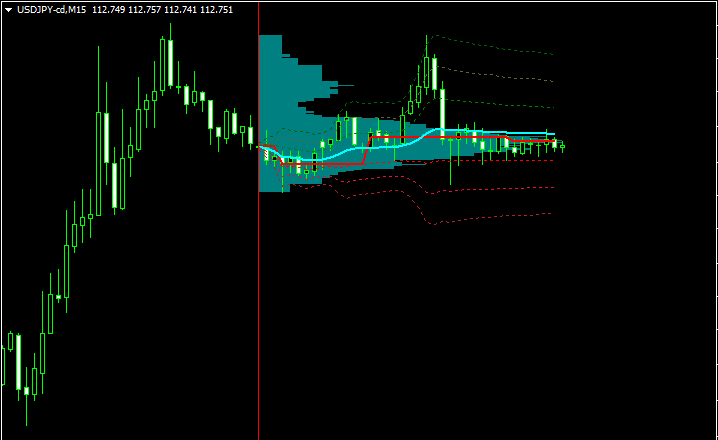
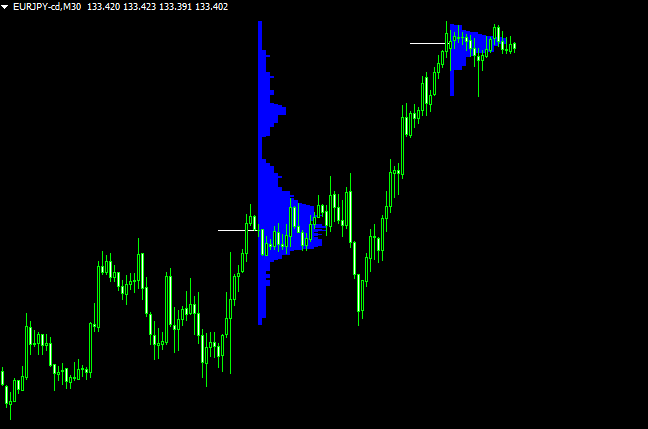 マーケットプロファイル
スタンダードなマーケットプロファイルを表示「market profile」
 トレンド表示型
CCIの値によってローソク足の色が変わる「CCI Candles mtf 2」
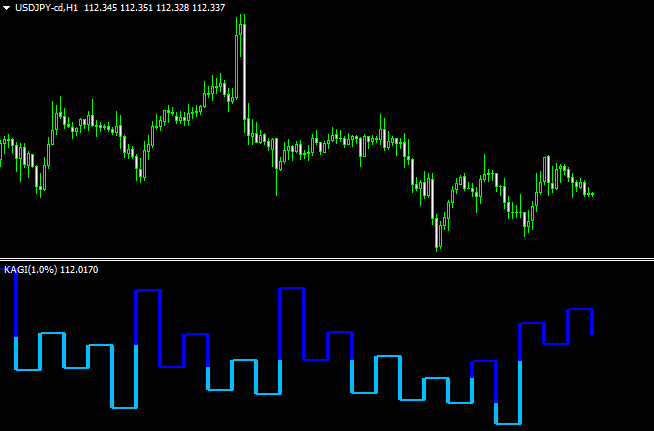 カギ足
カギ足チャート下にカギ足を表示させる「kagi_2」
 マーケットプロファイル
マーケットプロファイルを表示する「market-statistics」
 トレンド表示型
ストキャスティクスの状況がローソク足で判断できる!「Stoch Candle OverBought-Sold」
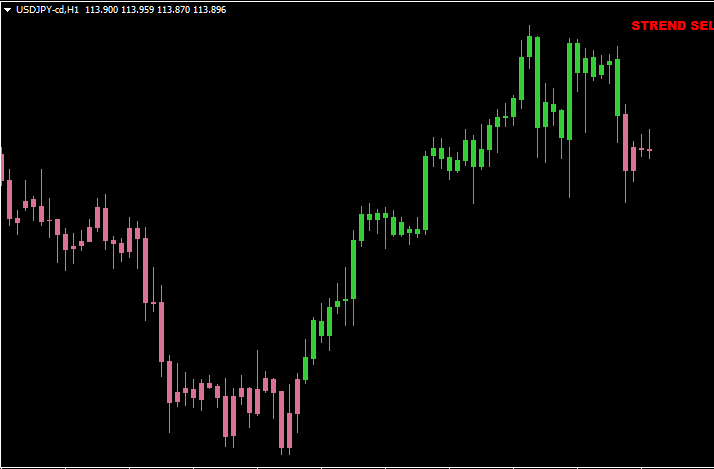
 トレンド表示型
VQのトレンドをローソク足の色に反映させる「VQ_bars」
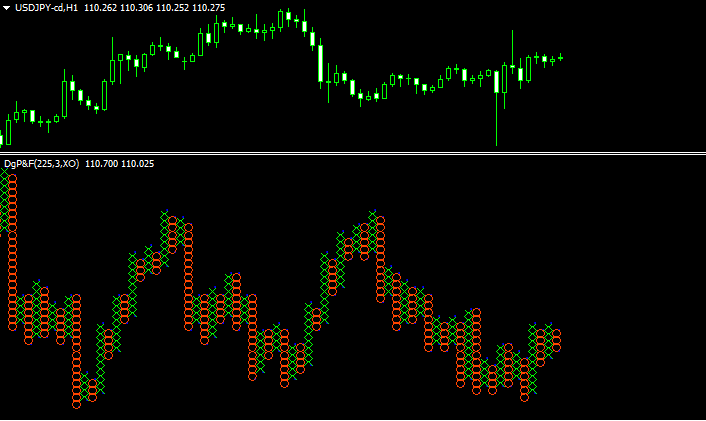 ポイント&フィギュア
MT4でポイント&フィギュアを表示させる「FXPNF_Indicator_2.0」
 平均足
平均足平均足を平滑化した平均足スムーズドを表示する「Heiken_Ashi_Smoothed」
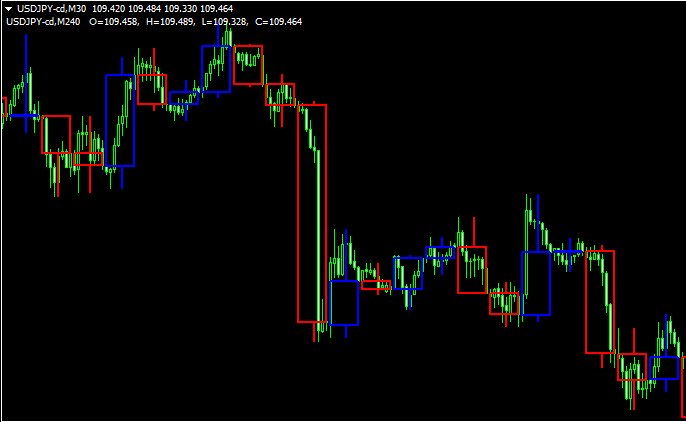 ローソク足
ローソク足上位足のローソク足を重ねて表示させる「CustomCandle6」
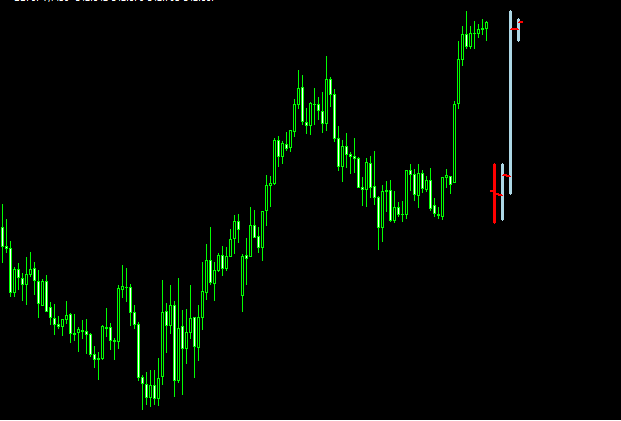 ローソク足
ローソク足チャート右に上位時間軸の足を表示できる「MTF_Candles」
勝てる手法10個+超凄いインジをプレゼント!

\初心者から上級者まで大注目!/
当サイト限定で、XMの口座開設をすると「Forex Standard Club XM版」へ無料招待!
✔️ 期間限定で13,000円のボーナス!
✔️ 最大500ドルまで100%入金ボーナス!
✔️ 勝率を上げるトレード手法&限定インジケーターを多数提供!
将来の動きを予測する無料ツール差し上げます

未来予測インジケーター「Futuro FX」は、過去の動きと現在の動きの相関から少し先の動きを予測します。メルマガ登録で詳しい解説書をプレゼント!
さらにスマートマネーコンセプト(SMC)について解説したPDFもプレゼント!
\初心者から上級者まで大注目!/
当サイト限定で、XMの口座開設をすると「Forex Standard Club XM版」へ無料招待!
✔️ 13,000円のボーナス!
✔️ 最大1000ドルまで100%入金ボーナス!
✔️ 勝率を上げるトレード手法&限定インジケーターを多数提供!