
 平均足
平均足○○足
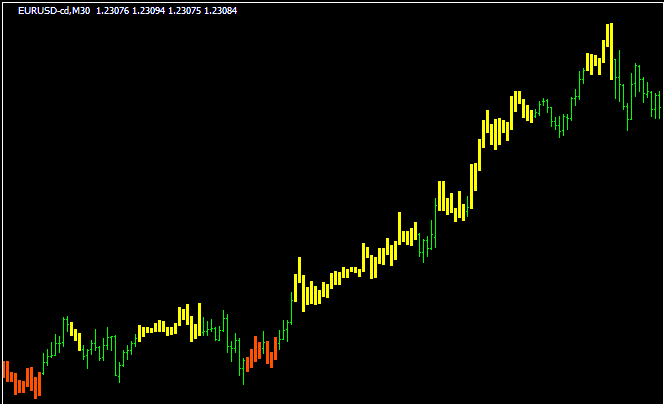
平均足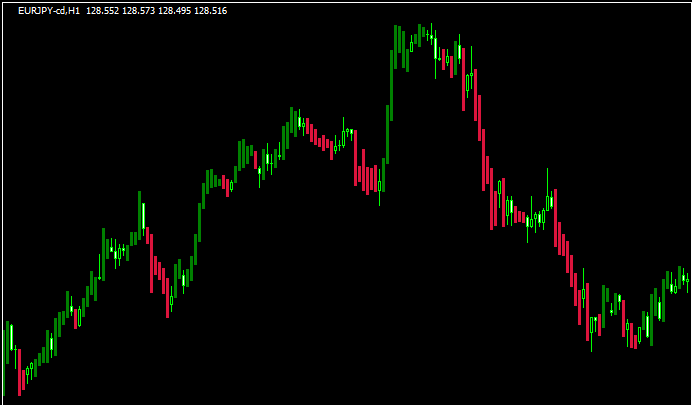 トレンド表示型
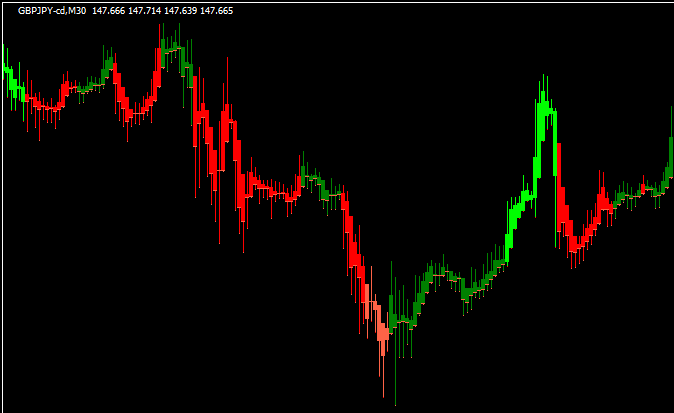
トレンドが出ると足が変わる「altr-trend-indicator」
 トレンド表示型
ADXのトレンドをローソク足で示す「adx-candles-indicator」
 トレンド表示型
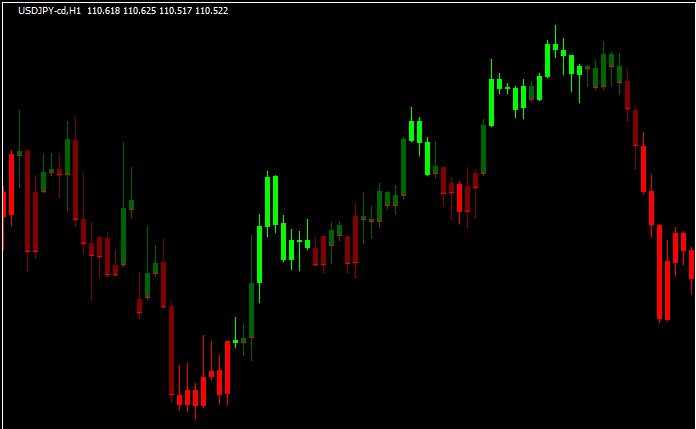
ストキャスティクスの挙動をローソク足に表示する「StochCandles」
 トレンド表示型
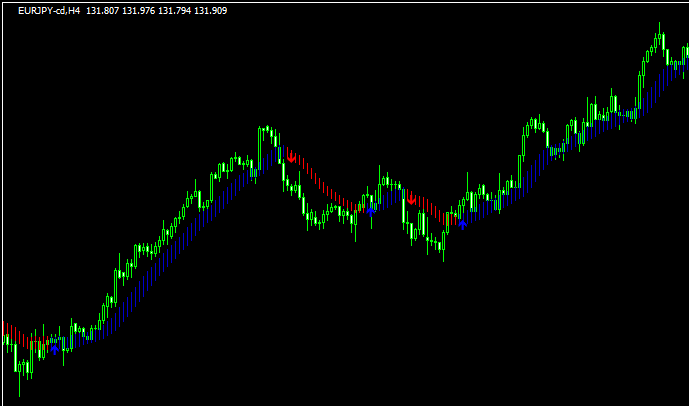
ブレイクを狙うのに役立つインジ「binary_breakerlines」
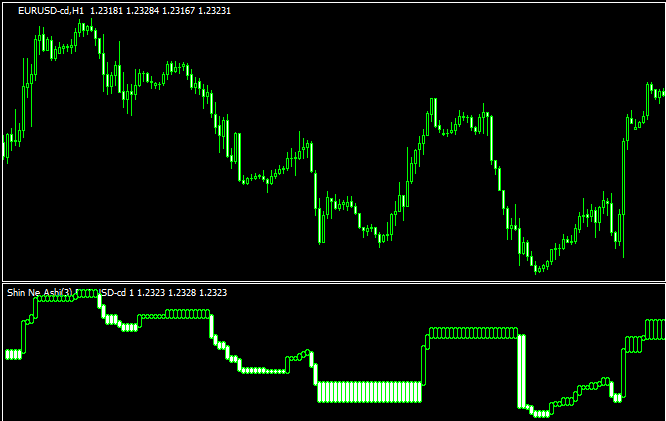 新値足
新値足チャート下に新値足を表示する「Shin Ne Ashi」
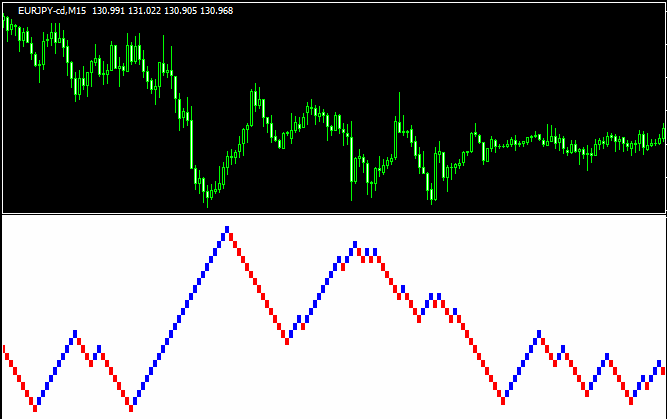 練行足
練行足サブウィンドウに練行足を表示する「RENKO」
 平均足
平均足平均足を色々な計算方法で「平均化」できる「heiken ashi averages」
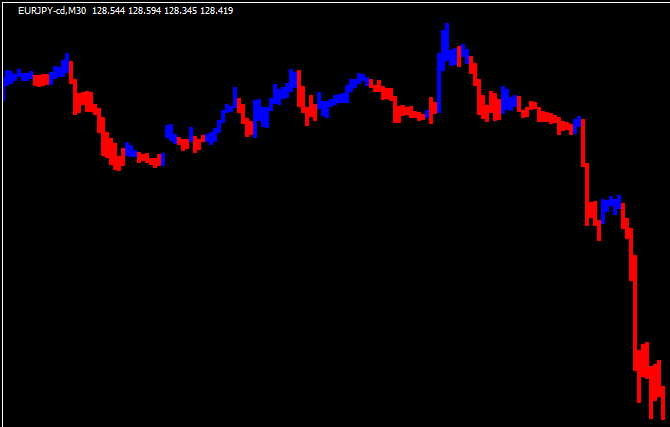
 トレンド表示型
トレンドが発生したら足の色が変わる「Detrended_Synthetic_Price_dbarsf」
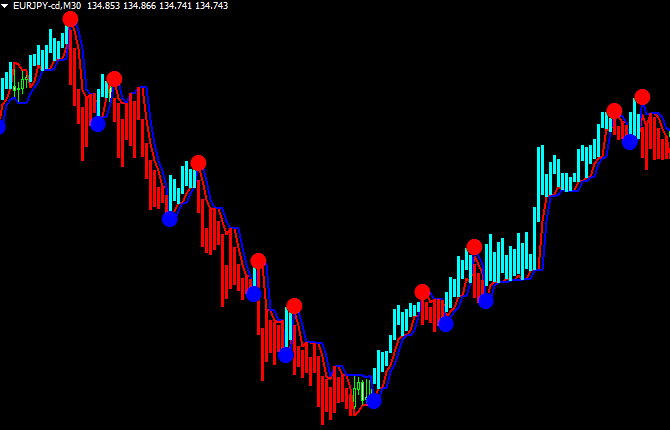 トレンド表示型
トレンドと売買ポイントが明確な「neurotrend」
 ローソク足
ローソク足チャート上に違う通貨ペアを表示する「Currency-Pairs-OverLay-Indicator」
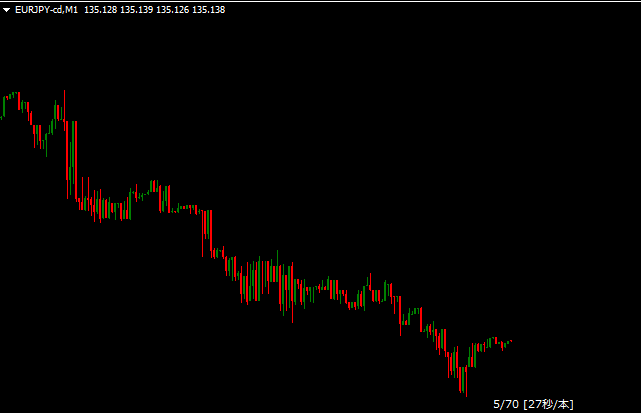 ティック
ティック70ティックチャートをMT4に表示させることを可能にした神インジ「tick_chart2」
 ポイント&フィギュア
ポイント&フィギュアを表示し、ラインまで引いてくれる「fxi_point&figure-adv」
 マーケットプロファイル
時間帯によって色が変わるマーケットプロファイル「MarketProfileCustomColor」
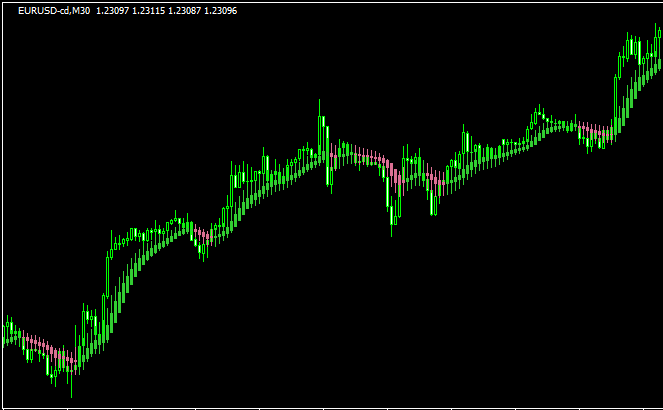
 平均足
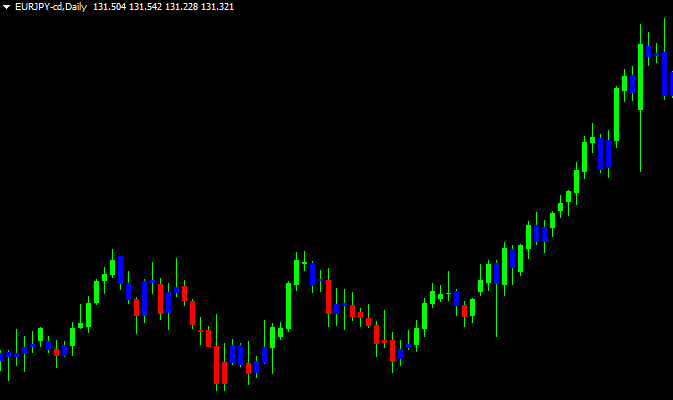
平均足レンジを示す平均足「painter」
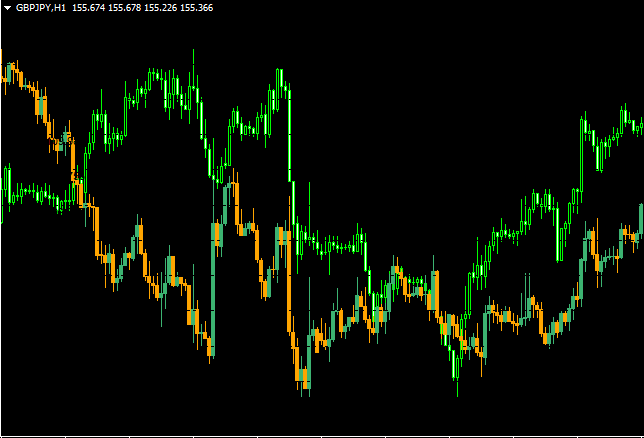
 トレンド表示型
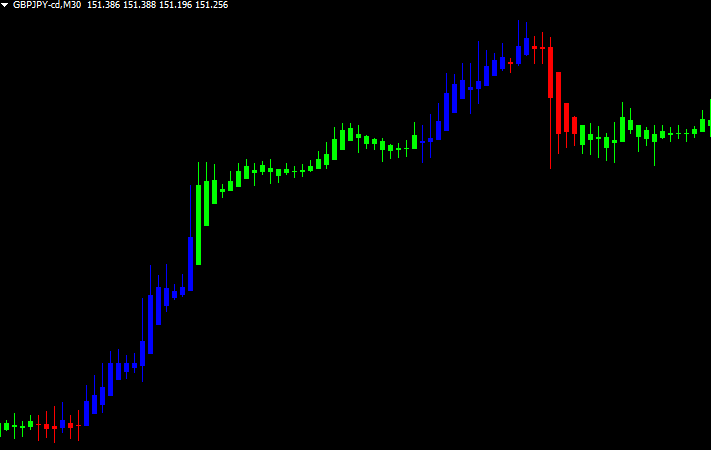
相場の勢いをローソク足の色に反映させる「Elder Impulse Candle Color」
勝てる手法10個+超凄いインジをプレゼント!

\初心者から上級者まで大注目!/
当サイト限定で、XMの口座開設をすると「Forex Standard Club XM版」へ無料招待!
✔️ 期間限定で13,000円のボーナス!
✔️ 最大500ドルまで100%入金ボーナス!
✔️ 勝率を上げるトレード手法&限定インジケーターを多数提供!
将来の動きを予測する無料ツール差し上げます

未来予測インジケーター「Futuro FX」は、過去の動きと現在の動きの相関から少し先の動きを予測します。メルマガ登録で詳しい解説書をプレゼント!
さらにスマートマネーコンセプト(SMC)について解説したPDFもプレゼント!
\初心者から上級者まで大注目!/
当サイト限定で、XMの口座開設をすると「Forex Standard Club XM版」へ無料招待!
✔️ 13,000円のボーナス!
✔️ 最大1000ドルまで100%入金ボーナス!
✔️ 勝率を上げるトレード手法&限定インジケーターを多数提供!