
 トレンド表示型
○○足
トレンド表示型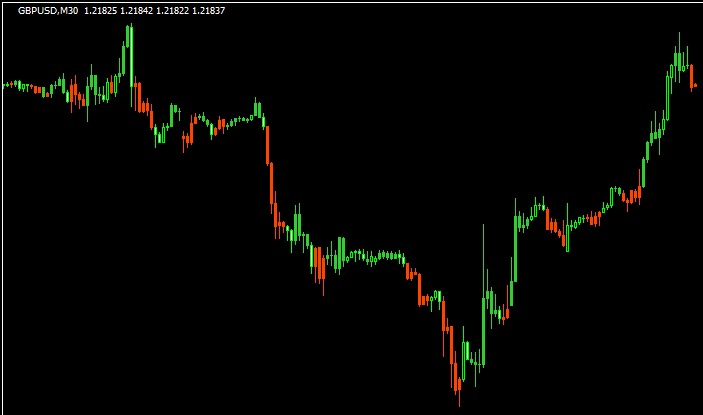 トレンド表示型
相場の向きによってローソク足の色が変わる「candlesticks-bw-indicator」
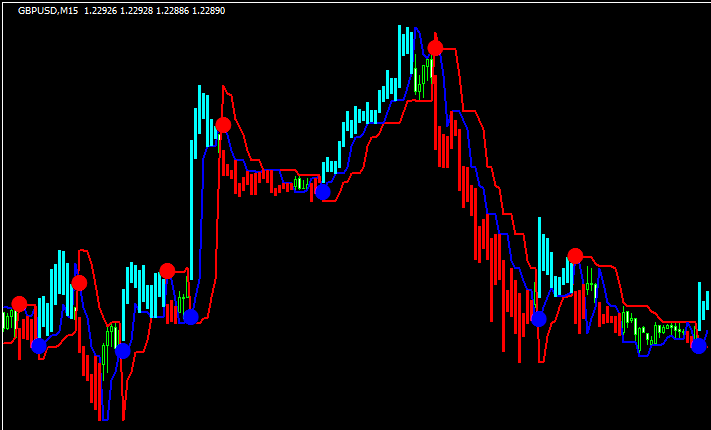
 平均足
平均足移動平均線、平均足、CCIでサインを出す「heiken-ashi-2xcci-ma-swing-mtf」
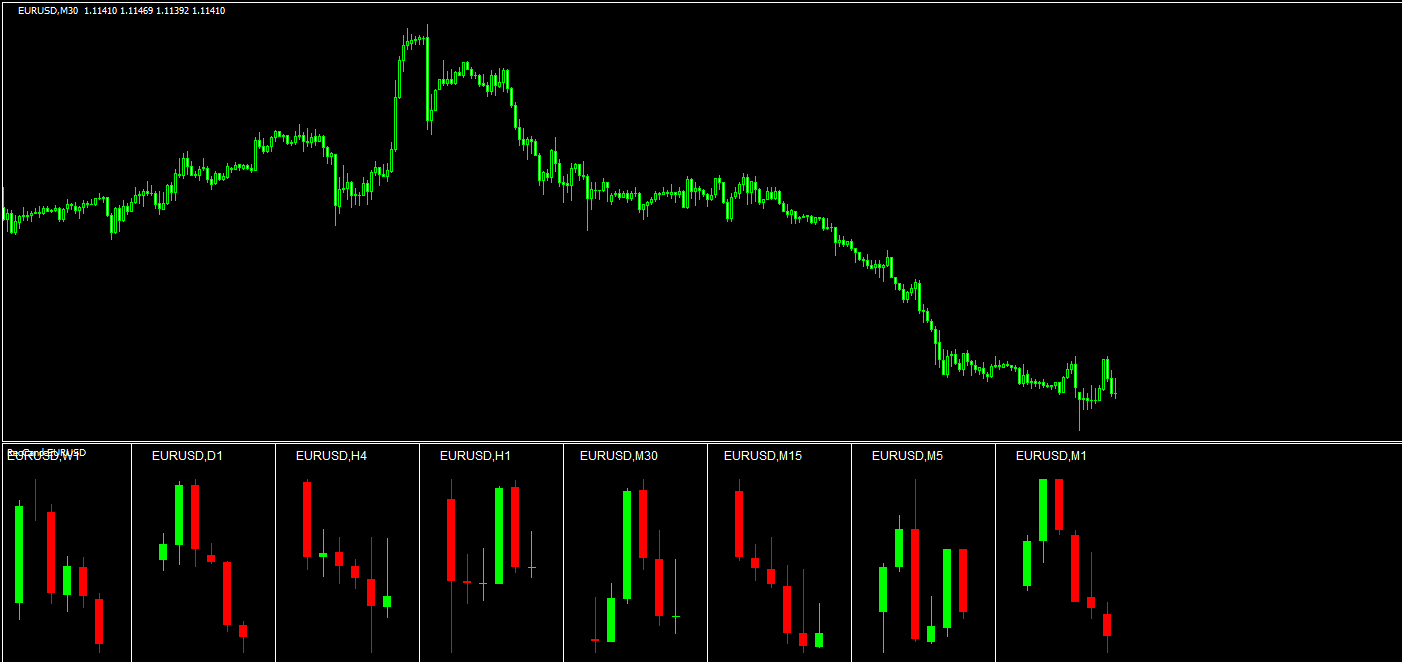
 ローソク足
ローソク足上位足のローソク足を重ねて表示するMT4インジ「m-Candles」
 トレンド表示型
RSIの「売られすぎ・買われすぎ」をローソク足に示す「RSI Candle OverBought-Sold」
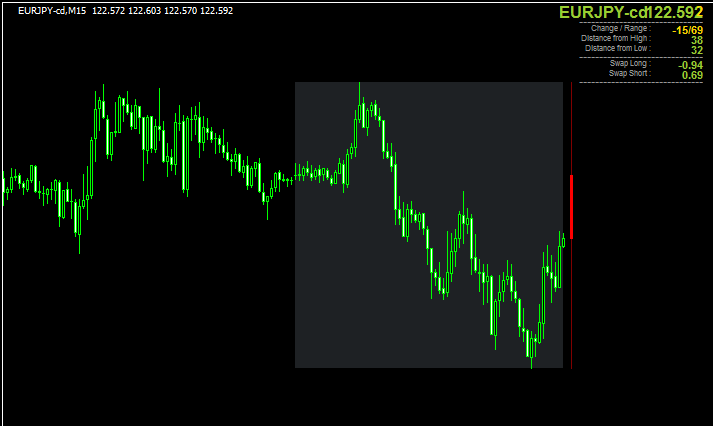
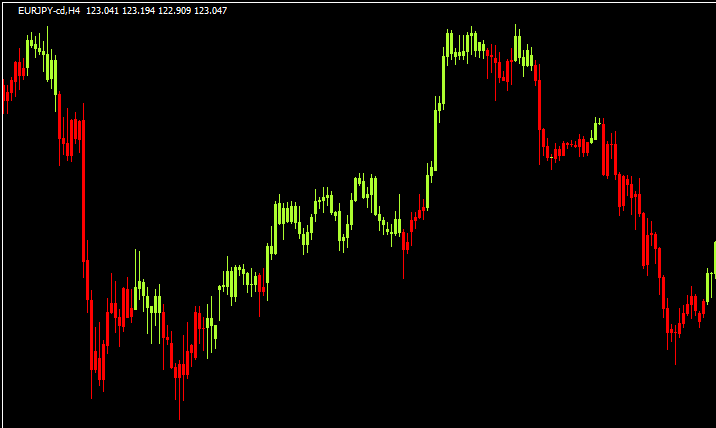
 ローソク足
ローソク足マルチタイムで直近のローソク足の動きの状況が見える「Recent Candles_wiedstone」
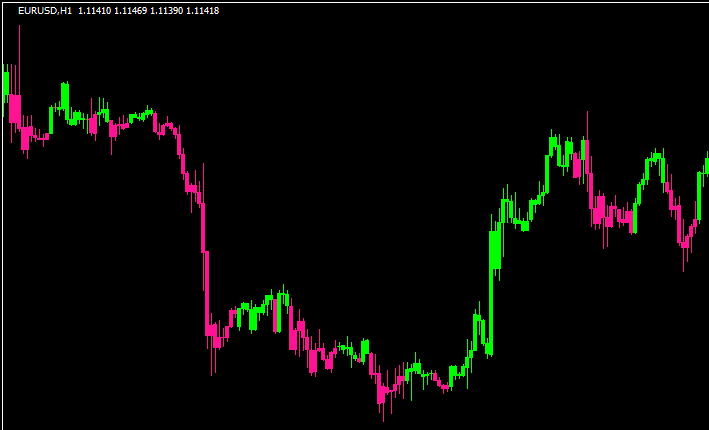 トレンド表示型
トレンド方向を示すローソク足「trend-candlesticks」
 平均足
平均足平均足の同時足を分かりやすく表示する「HeikenAshi_DojiSpotter_Alert」
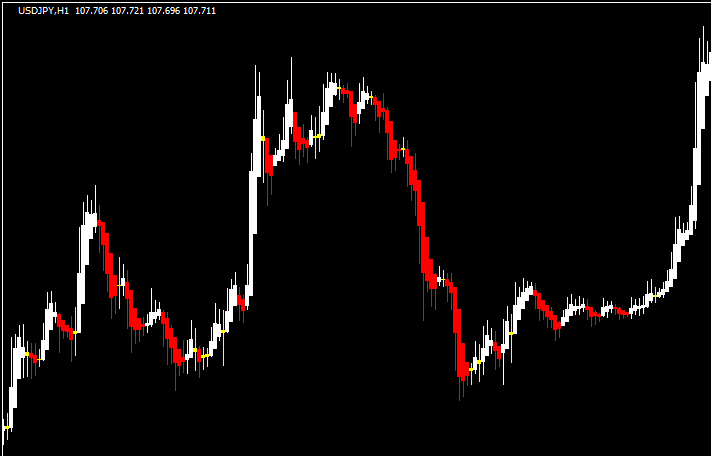
 トレンド表示型
ローソク足の色でトレンド方向を示す「Pet-D_2」
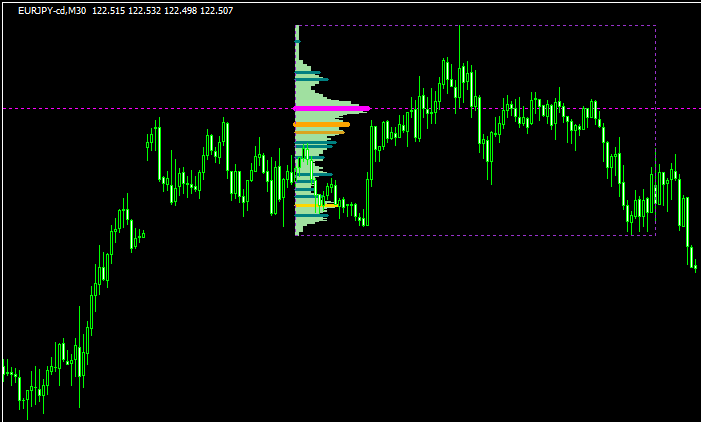 マーケットプロファイル
週足用のマーケットプロファイル「23tpo-cv4」
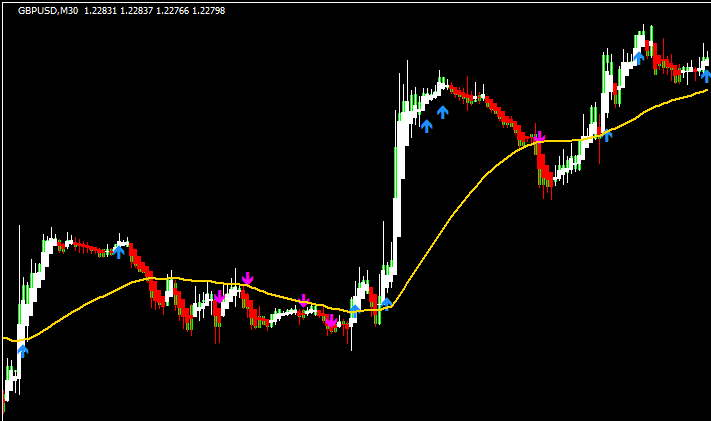
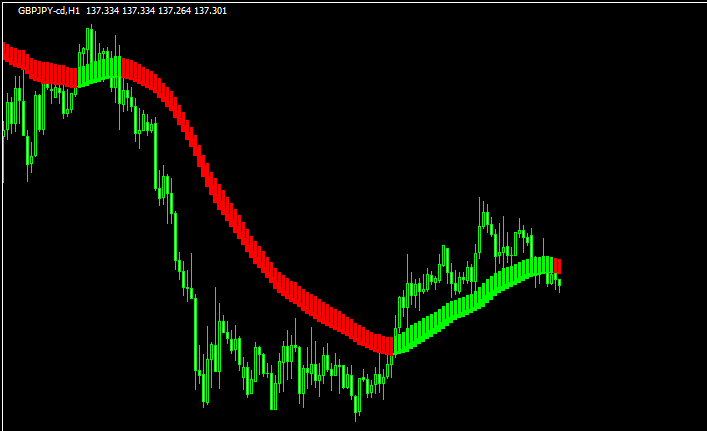
 トレンド表示型
良い感じでトレンド方向を示す「precision trend 2.2 (alerts)」
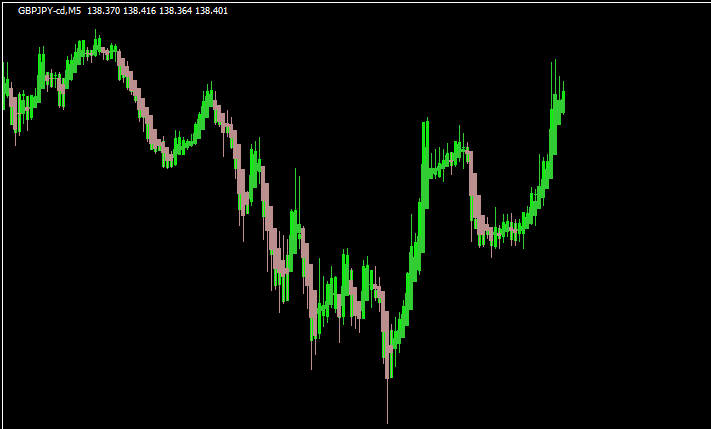
 平均足
平均足平均足を更に平均化した「heiken-ashi-exit」
 平均足
平均足平均足の陽線か陰線が何本か連続したらアラートの鳴る「Heiken Ashi Candle Count Alert」
 ローソク足
ローソク足その日の日足の状況が分かる「Daily_Data_narrow」
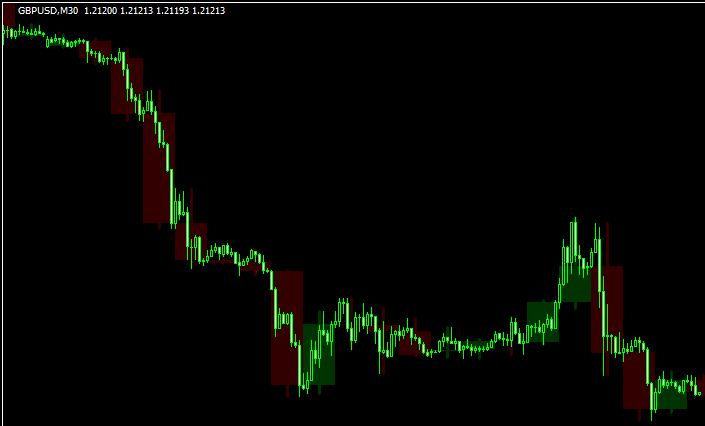
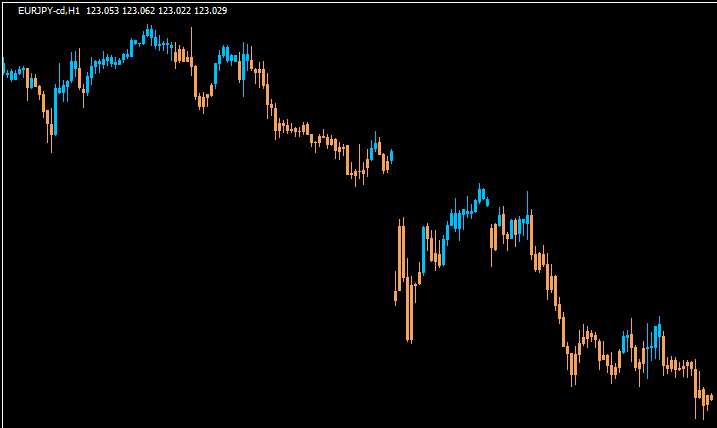
 トレンド表示型
相場の状況でローソク足の色が変わる「CandleBreaker」
 トレンド表示型
トレンドとレンジをハッキリ区別できる「Averages Channel Candles + alerts 2.07」
勝てる手法10個+超凄いインジをプレゼント!

\初心者から上級者まで大注目!/
当サイト限定で、XMの口座開設をすると「Forex Standard Club XM版」へ無料招待!
✔️ 期間限定で13,000円のボーナス!
✔️ 最大500ドルまで100%入金ボーナス!
✔️ 勝率を上げるトレード手法&限定インジケーターを多数提供!
将来の動きを予測する無料ツール差し上げます

未来予測インジケーター「Futuro FX」は、過去の動きと現在の動きの相関から少し先の動きを予測します。メルマガ登録で詳しい解説書をプレゼント!
さらにスマートマネーコンセプト(SMC)について解説したPDFもプレゼント!
\初心者から上級者まで大注目!/
当サイト限定で、XMの口座開設をすると「Forex Standard Club XM版」へ無料招待!
✔️ 13,000円のボーナス!
✔️ 最大1000ドルまで100%入金ボーナス!
✔️ 勝率を上げるトレード手法&限定インジケーターを多数提供!