
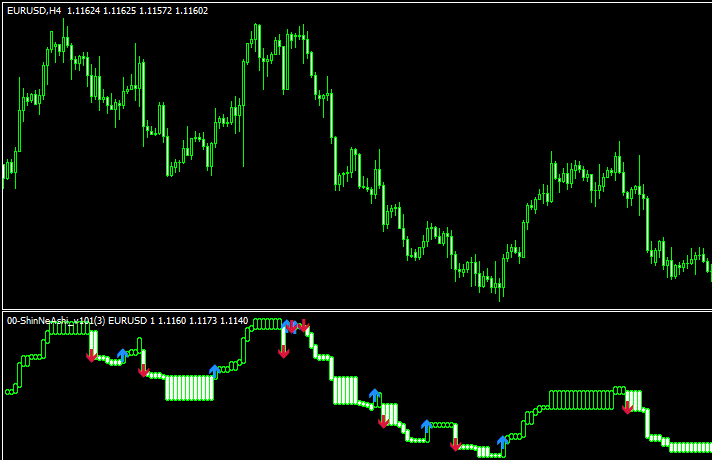
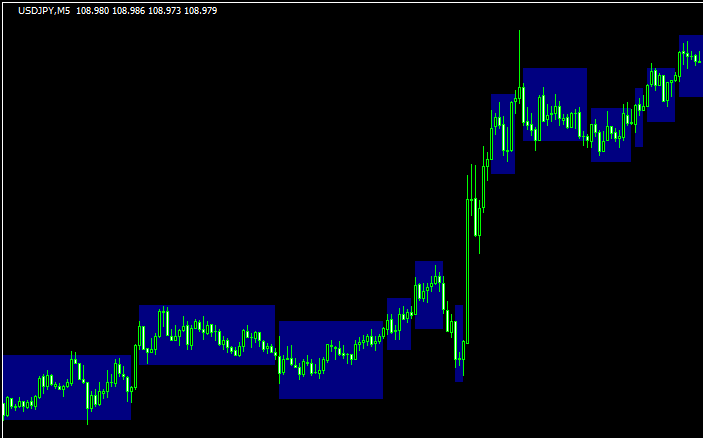
 新値足
新値足○○足
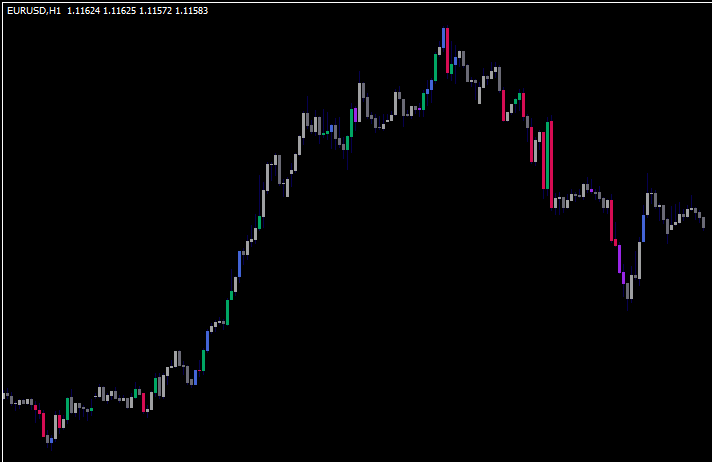
新値足 ローソク足
ローソク足ローソク足の値幅を示す「CandlePipsv1.2」
 ローソク足
ローソク足相場の勢いをローソク足に示す「candles-suite」
 ローソク足
ローソク足上位足のローソク足が表示される「Candle Display v2 nmc」
 ローソク足
ローソク足勢いのある足を目立たせる「Momentum Candles v1.01」
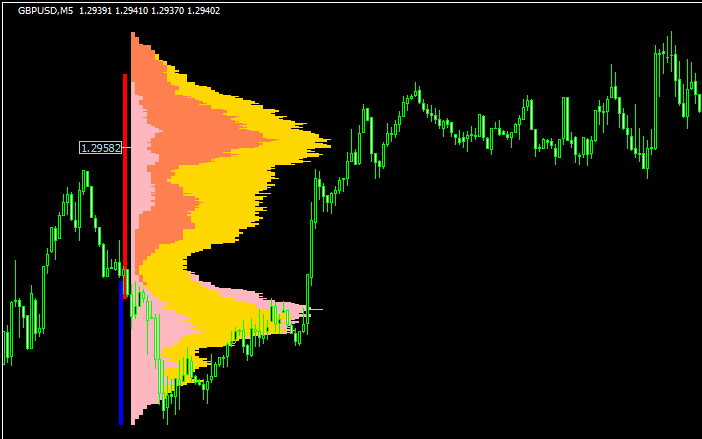
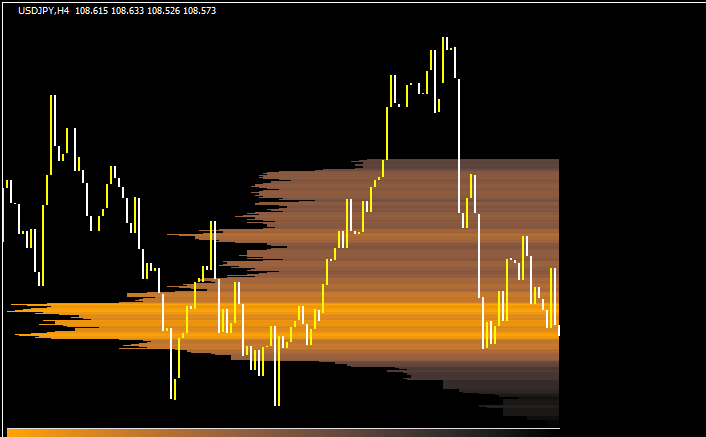 マーケットプロファイル
プライスバンド(価格帯別出来高)が表示できる「00-PriceBand」
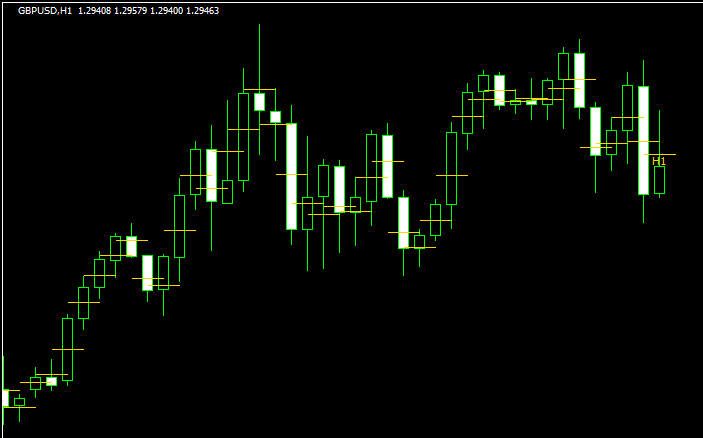
 トレンド表示型
基準線を基準にローソク足の色が変わる「kijun sen candles alerts」
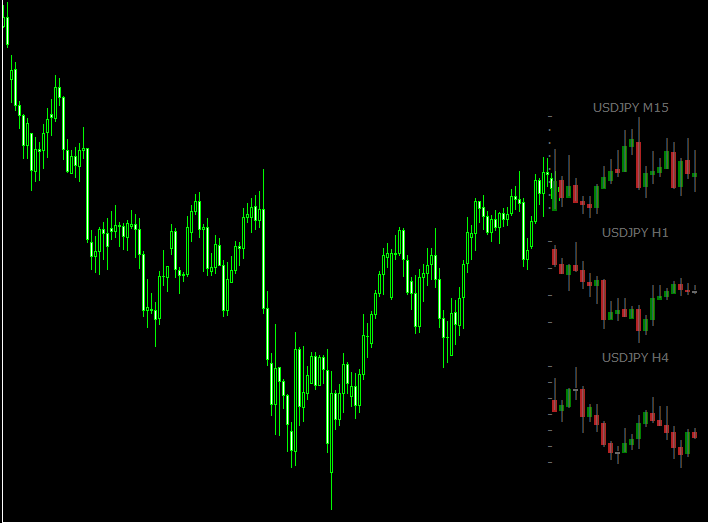 ローソク足
ローソク足ミニチャートを並べて表示できる「Stratman_MiniChart_v12」
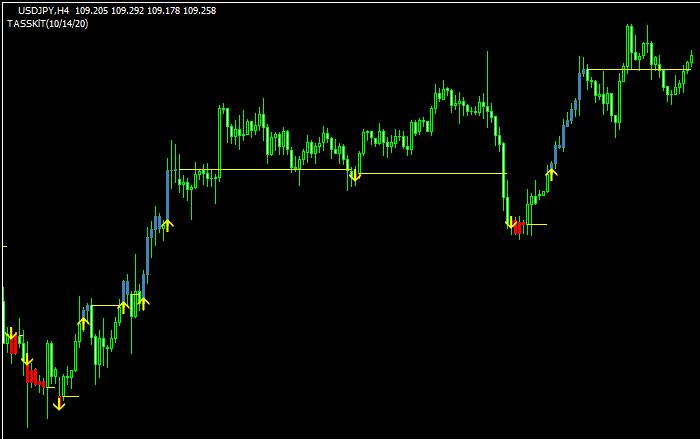 トレンド表示型
トレンドが視覚化される「easytrendvisualizer」
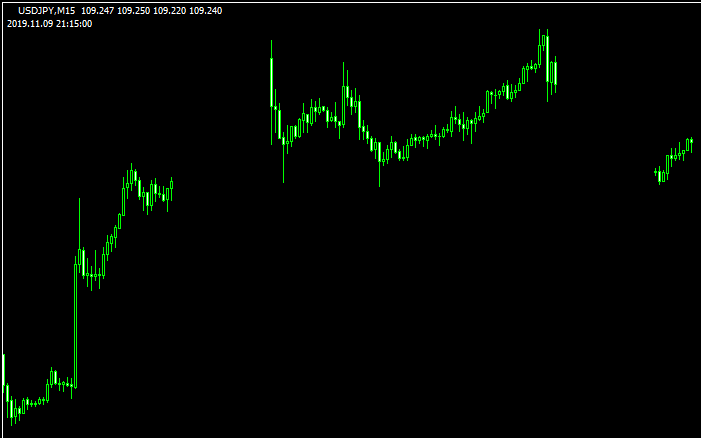 ローソク足
ローソク足特定の時間帯のローソク足を消す「HideMyCandles」
 トレンド表示型
横ばいの値動きを判定するSidewaysDetector
 マーケットプロファイル
市場ごとに色わけされたマーケットプロファイル「R-MarketProfile」
 ローソク足
ローソク足ローソク足の半値を表示する「Candle 50% MTF nmc」
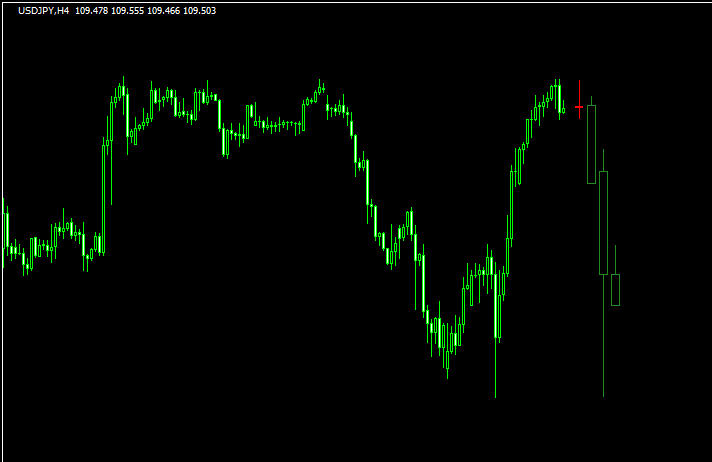
![Heiken_Ashi MA T3 new[Alert] mtfのチャート画像](https://technical-indicators.com/wp-content/uploads/2019/10/USDCHFH4_2019.10.31_115401.png) 平均足
平均足マルチタイムに対応した平均足T3「Heiken_Ashi MA T3 new[Alert] mtf」
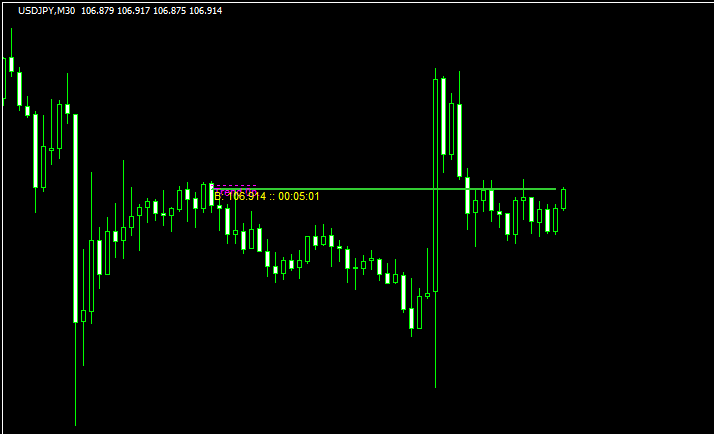 ローソク足
ローソク足足が確定するまでの残り時間を表示する「dynamic_candle_timer」
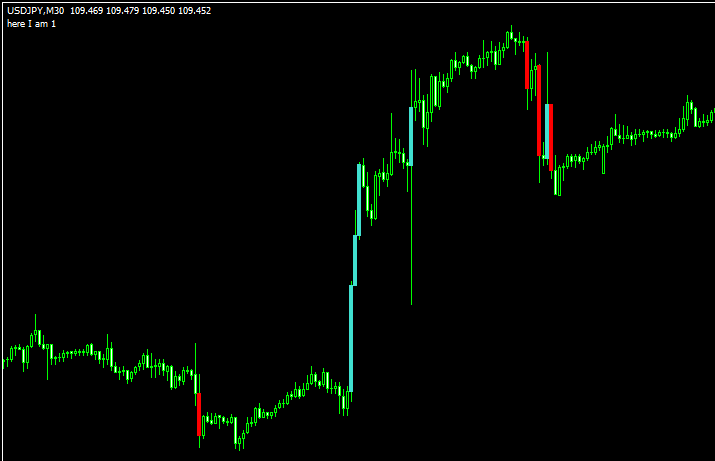
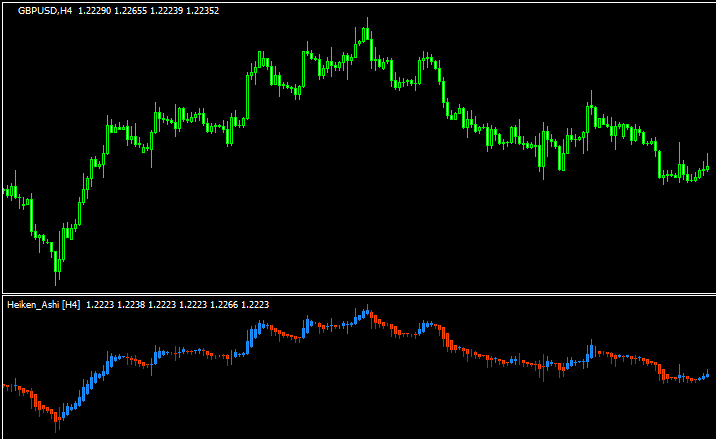 平均足
平均足サブウィンドウにマルチタイムの平均足を表示する「mtf-heiken-ashi-indicator」
勝てる手法10個+超凄いインジをプレゼント!

\初心者から上級者まで大注目!/
当サイト限定で、XMの口座開設をすると「Forex Standard Club XM版」へ無料招待!
✔️ 期間限定で13,000円のボーナス!
✔️ 最大500ドルまで100%入金ボーナス!
✔️ 勝率を上げるトレード手法&限定インジケーターを多数提供!
将来の動きを予測する無料ツール差し上げます

未来予測インジケーター「Futuro FX」は、過去の動きと現在の動きの相関から少し先の動きを予測します。メルマガ登録で詳しい解説書をプレゼント!
さらにスマートマネーコンセプト(SMC)について解説したPDFもプレゼント!
\初心者から上級者まで大注目!/
当サイト限定で、XMの口座開設をすると「Forex Standard Club XM版」へ無料招待!
✔️ 13,000円のボーナス!
✔️ 最大1000ドルまで100%入金ボーナス!
✔️ 勝率を上げるトレード手法&限定インジケーターを多数提供!