
 バータイプ
バータイプバータイプ
バータイプ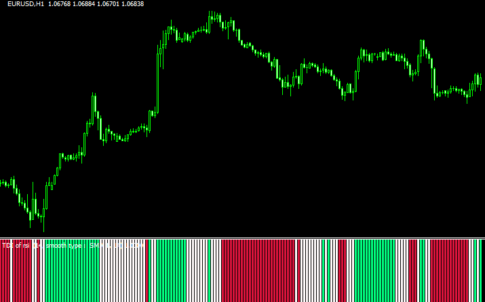 バータイプ
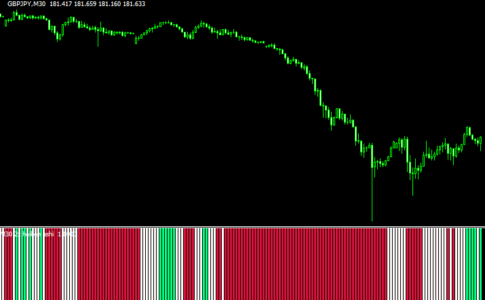
バータイプTDIの状況をバーで表示する「TDI(fDashboard)」
 バータイプ
バータイプMFIとRSIの示す方向をバーで示す「histo (rsi+mfi)」
 バータイプ
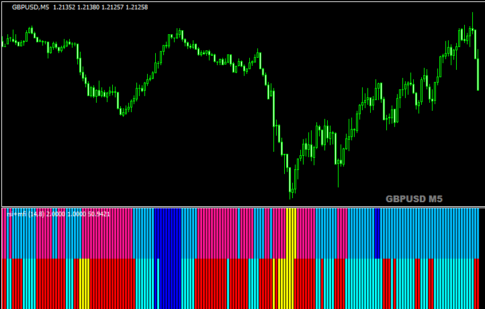
バータイプAPBなど4つの指標の向きをバーで示す「histo (acc+ ao + apb) 1.1」
 バータイプ
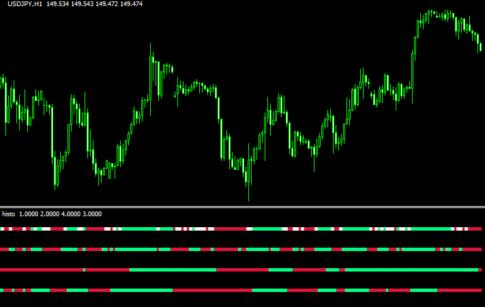
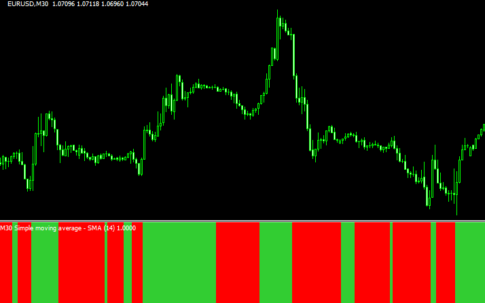
バータイプ移動平均線と終値の位置で色の変わる「averages – mtf – alerts 8.9 Histo」
 バータイプ
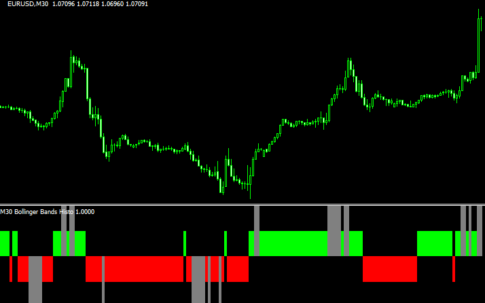
バータイプボリバンとローソク足の状況を示す「Bollinger bands – histo (mtf + alerts)」
 バータイプ
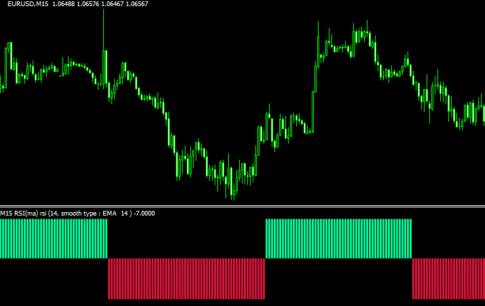
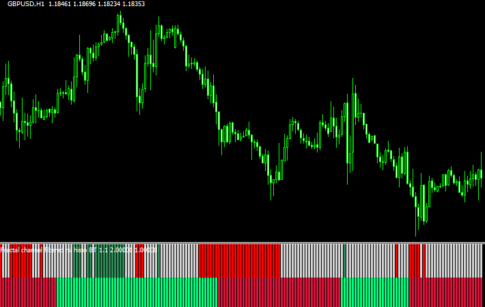
バータイプRSIの状況をバーで示す「rsi (+ histo) 」
 バータイプ
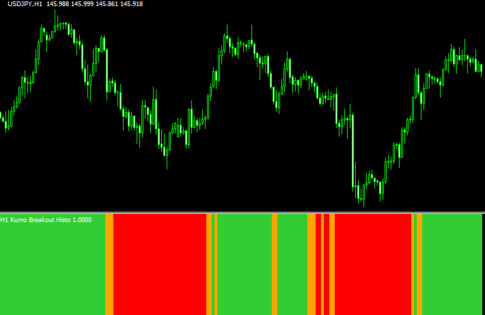
バータイプローソク足と雲の位置関係をバーの色で示す「Kumo Breakout Histo (mtf + lines)」
 バータイプ
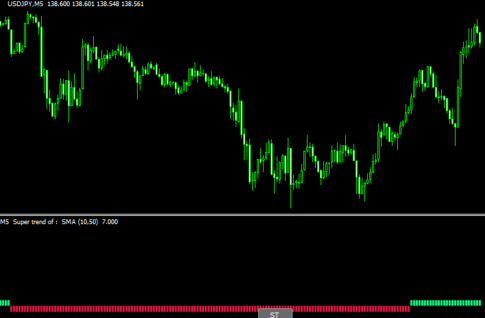
バータイプ様々な計算方法に対応したスーパートレンドをバーで表示する「Super trend (+histo+BT)」
 バータイプ
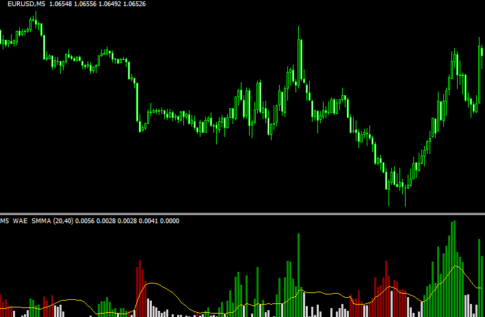
バータイプトレンド方向を示し、サインも出るインジ「WAE(mtf)1.1」
 バータイプ
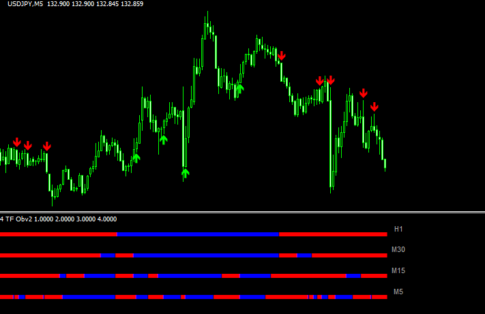
バータイプ4つの時間足でOBVの方向を示しサインも出す「4 time frame – OBV2 arrows」
 バータイプ
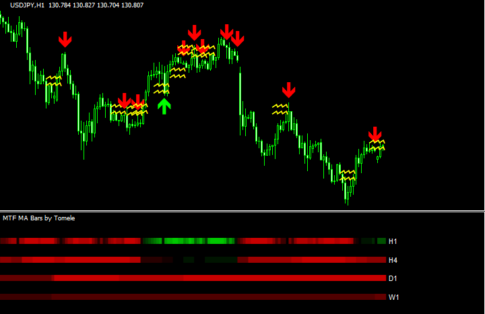
バータイプ5つの移動平均線から現在のトレンド方向を導き出す「MTF MA Bars」
 バータイプ
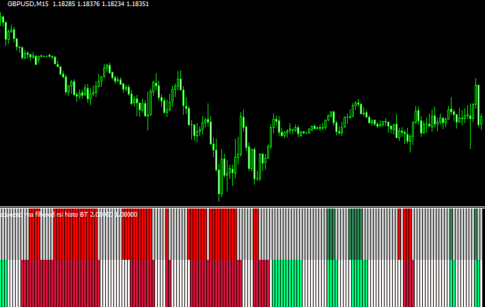
バータイプスクイーズドMAの方向が分かりやすいバー「squezed ma filtered rsi histo BT」
 バータイプ
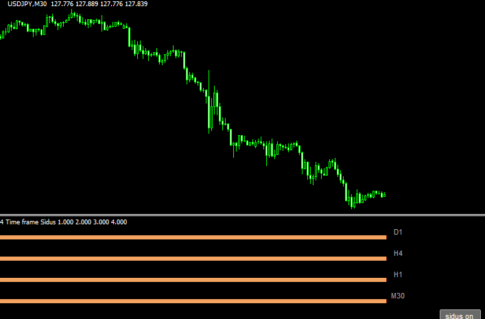
バータイプ4つの時間足でSidusの方向を示す「4 time frame – Sidus 1.01 bt」
 バータイプ
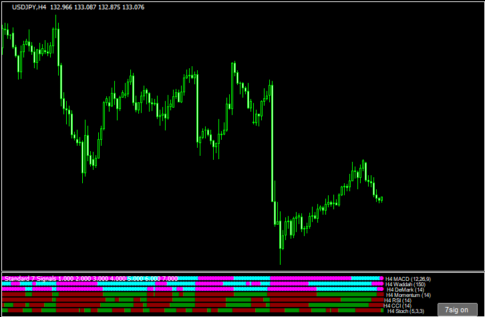
バータイプ7つの指標で相場の方向を示す「##Standard 7 Signals mtf BT」
 バータイプ
バータイプRSIとフラクタルチャネルの状況をバーの色で示す「Fractal channel filtered rsi histo BT 1.1」
勝てる手法10個+超凄いインジをプレゼント!

\初心者から上級者まで大注目!/
当サイト限定で、XMの口座開設をすると「Forex Standard Club XM版」へ無料招待!
✔️ 期間限定で13,000円のボーナス!
✔️ 最大500ドルまで100%入金ボーナス!
✔️ 勝率を上げるトレード手法&限定インジケーターを多数提供!
将来の動きを予測する無料ツール差し上げます

未来予測インジケーター「Futuro FX」は、過去の動きと現在の動きの相関から少し先の動きを予測します。メルマガ登録で詳しい解説書をプレゼント!
さらにスマートマネーコンセプト(SMC)について解説したPDFもプレゼント!
\初心者から上級者まで大注目!/
当サイト限定で、XMの口座開設をすると「Forex Standard Club XM版」へ無料招待!
✔️ 13,000円のボーナス!
✔️ 最大1000ドルまで100%入金ボーナス!
✔️ 勝率を上げるトレード手法&限定インジケーターを多数提供!