
 バータイプ
バータイプバータイプ
バータイプ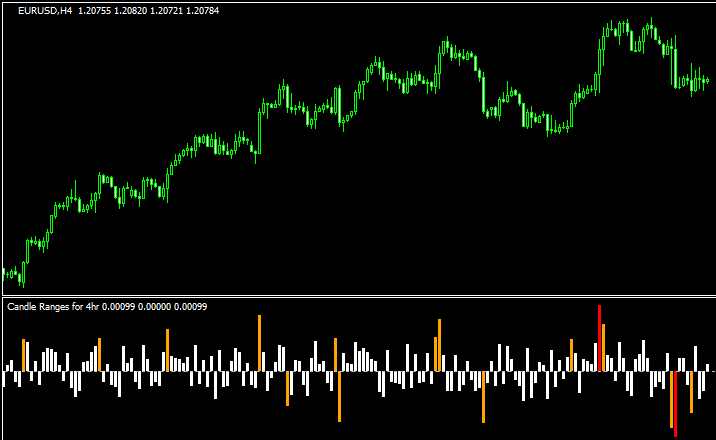 バータイプ
バータイプローソク足の値幅をバーで示す「Candle_Range_MTF」
 バータイプ
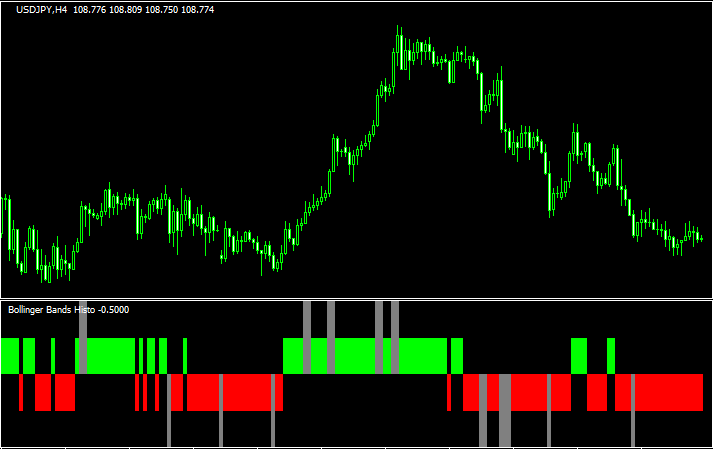
バータイプボリバンのバンドウォークやトレンドが分かりやすくなる「Bollinger bands – histo」
 バータイプ
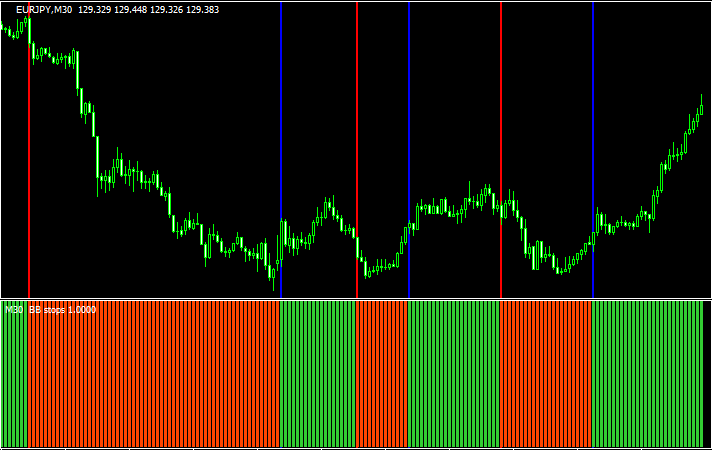
バータイプBBストップのトレンドをサブチャートに表示する「BB stops (new format – histo + lines) 1.3」
 バータイプ
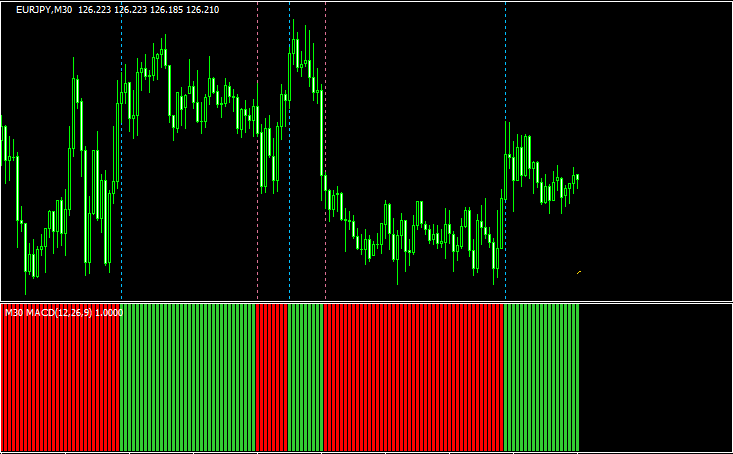
バータイプマルチタイムに対応し、ヒストグラムのクロスが分かりやすいMACD「MACD Predictor Histo Universal MTF Alerts Lines」
 バータイプ
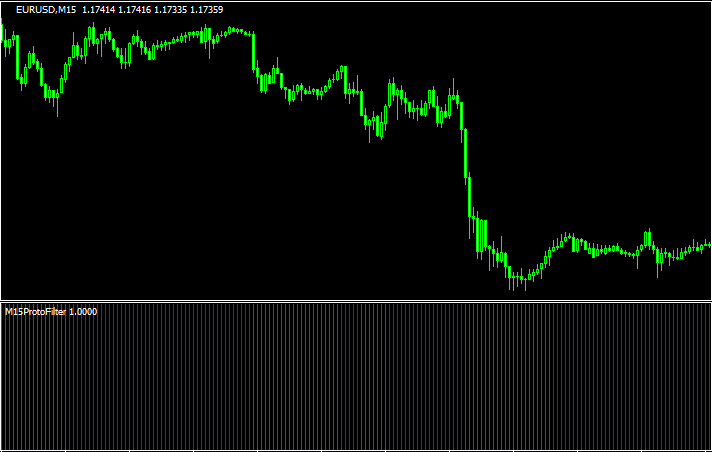
バータイプ相場のトレンド方向を示す「protofilter」
 バータイプ
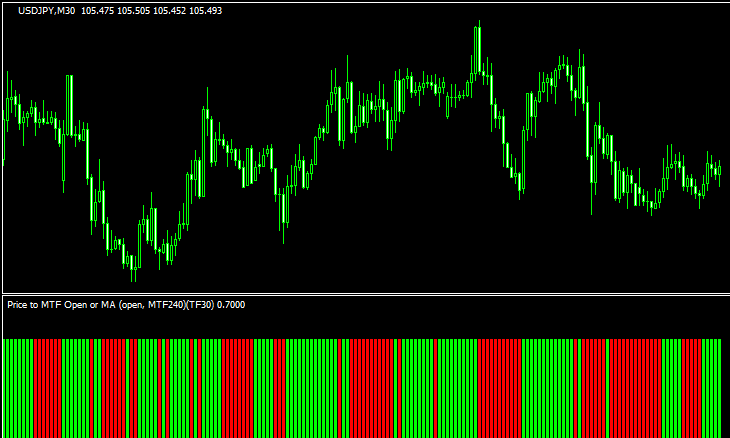
バータイプ終値と上位足の始値やMAを比較する「Price_to_MTF_Open_or_MA_v1.2」
 バータイプ
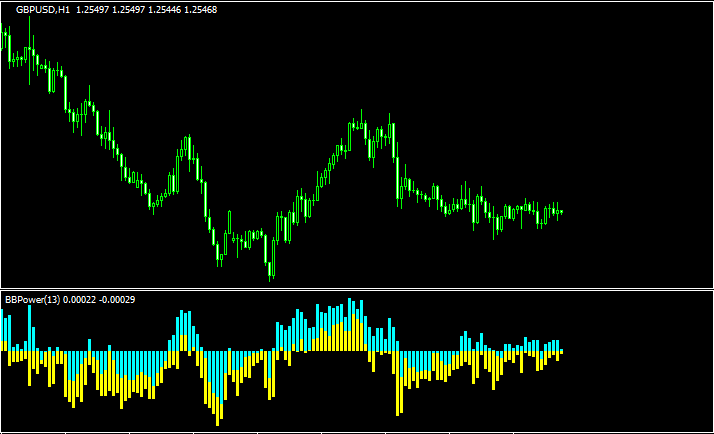
バータイプ売りと買いの力関係が分かりやすい「BearsBullsPower」
 バータイプ
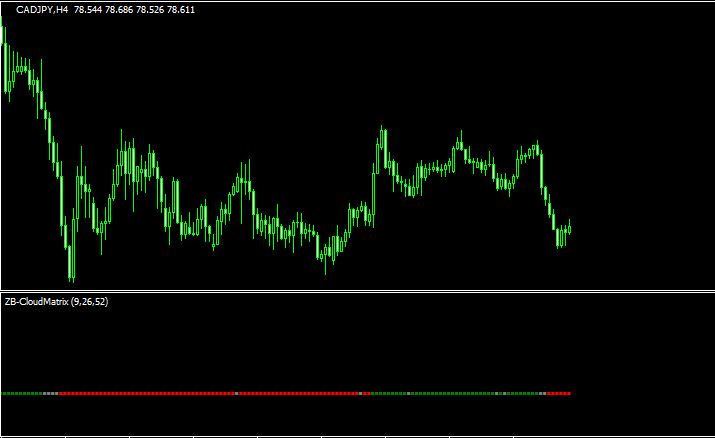
バータイプ一目均衡表の雲とローソク足の位置関係を示す「ZB-CloudMatrix 2」
 バータイプ
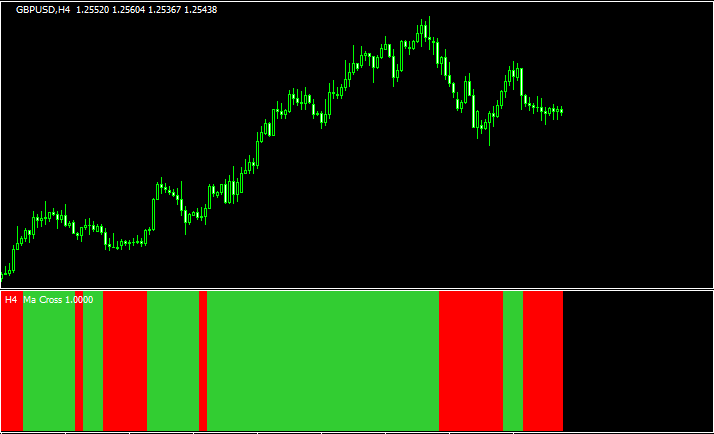
バータイプMAと価格の位置関係が分かりやすい「price_cross_ma_histo_mtfalerts_nmc」
 バータイプ
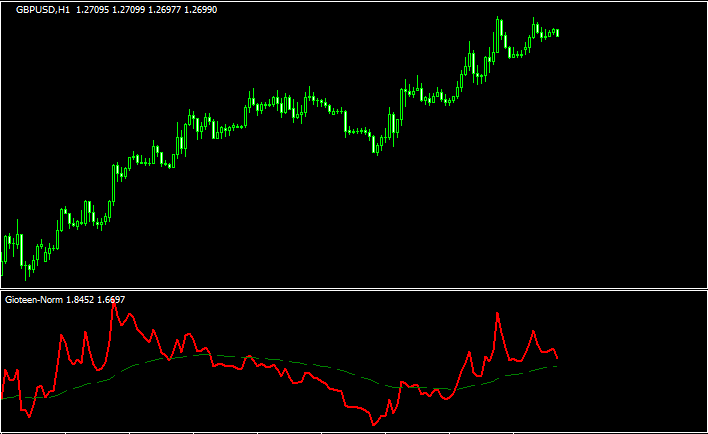
バータイプ価格の勢いに反応する「Gioteen-Norm」
 バータイプ
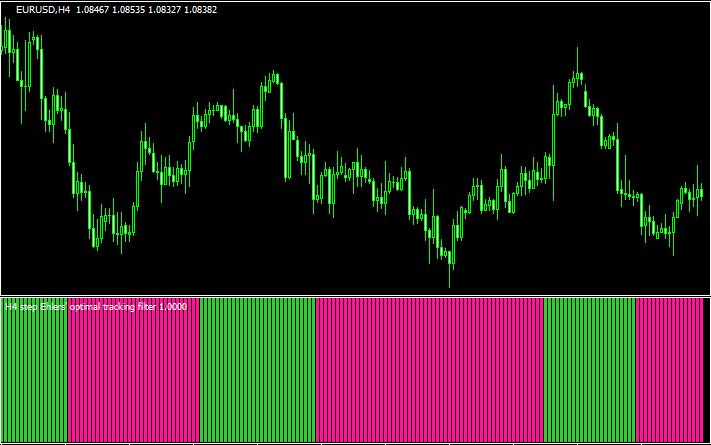
バータイプチャート下にトレンド方向を示す「step ehlers optimal tracking filter histo (mtf + alerts)」
 バータイプ
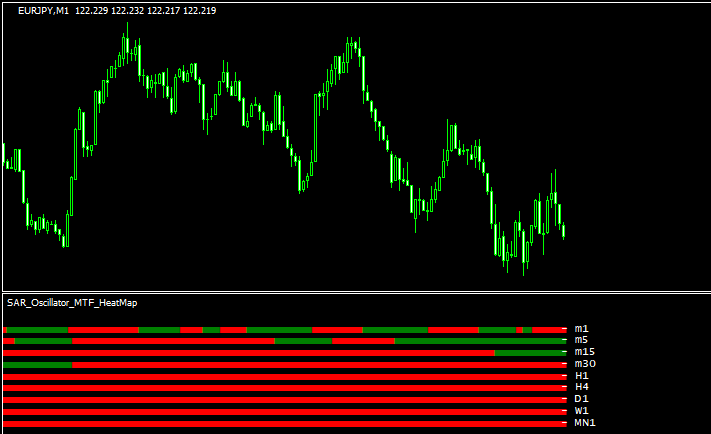
バータイプマルチタイムでパラボリックの状況を表示する「SAR_Oscillator_MTF_Heatmap」
 バータイプ
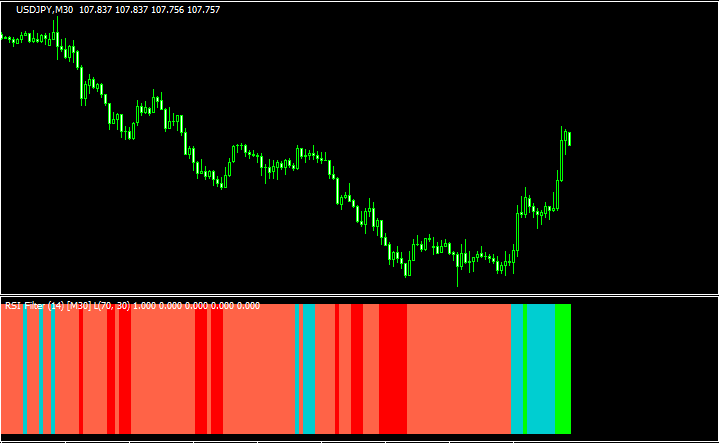
バータイプRSIの状況をバーで示す多機能インジ「RSI_Filter_vX2D2alert_mtf」
 バータイプ
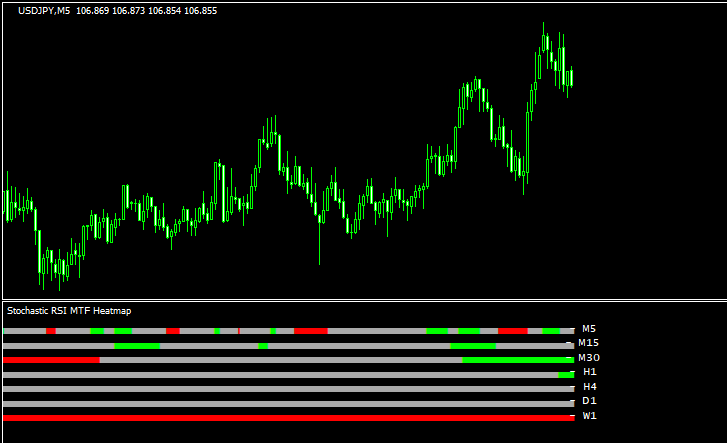
バータイプストキャスティクスRSIをバーで表示する「Stochastic_RSI_MTF_Heatmap」
 バータイプ
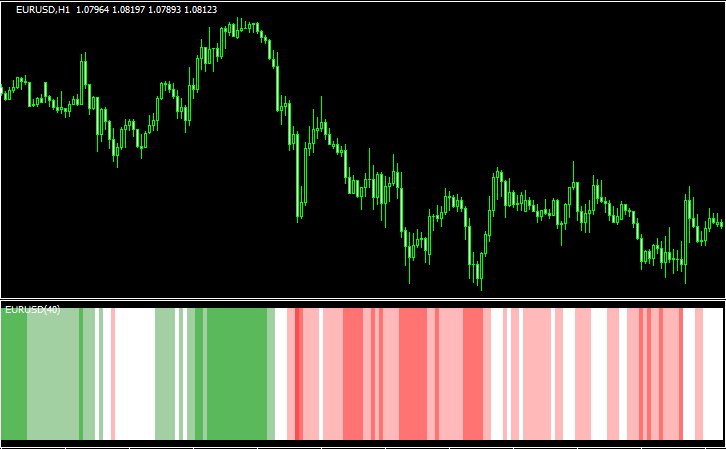
バータイプRSIの値によって色の変わるインジ「multisymbol_color-rsi_lq_1.0」
勝てる手法10個+超凄いインジをプレゼント!

\初心者から上級者まで大注目!/
当サイト限定で、XMの口座開設をすると「Forex Standard Club XM版」へ無料招待!
✔️ 期間限定で13,000円のボーナス!
✔️ 最大500ドルまで100%入金ボーナス!
✔️ 勝率を上げるトレード手法&限定インジケーターを多数提供!
将来の動きを予測する無料ツール差し上げます

未来予測インジケーター「Futuro FX」は、過去の動きと現在の動きの相関から少し先の動きを予測します。メルマガ登録で詳しい解説書をプレゼント!
さらにスマートマネーコンセプト(SMC)について解説したPDFもプレゼント!
\初心者から上級者まで大注目!/
当サイト限定で、XMの口座開設をすると「Forex Standard Club XM版」へ無料招待!
✔️ 13,000円のボーナス!
✔️ 最大1000ドルまで100%入金ボーナス!
✔️ 勝率を上げるトレード手法&限定インジケーターを多数提供!