
 ラインタイプ
ラインタイプ
ラインタイプ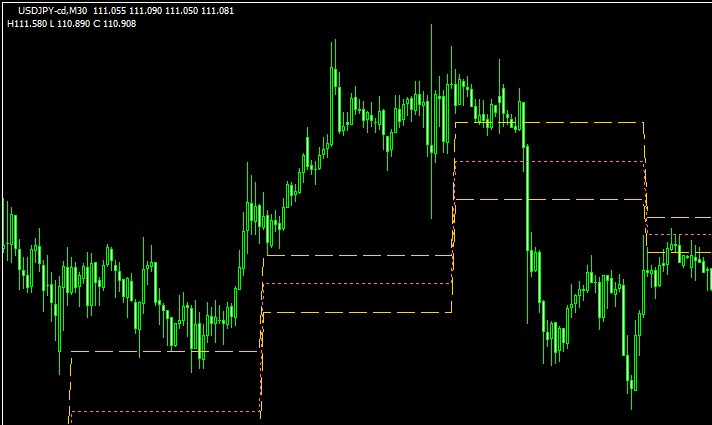 ラインタイプ
3日間の高値・安値・終値を利用して算出される「three-day-rolling-pivot」
 ラインタイプ
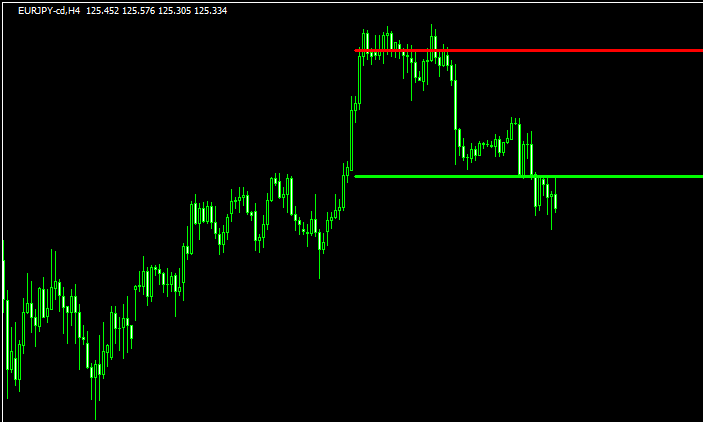
直近の高値安値に水平線を引く「zz-sr-tl-indicator」
 ラインタイプ
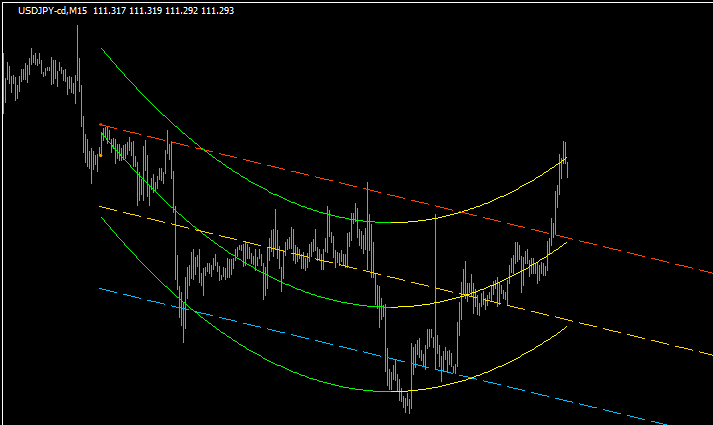
様々なラインを表示して市場の流れを見やすくする「jX_ParabolicRegression_StopAndReverse」
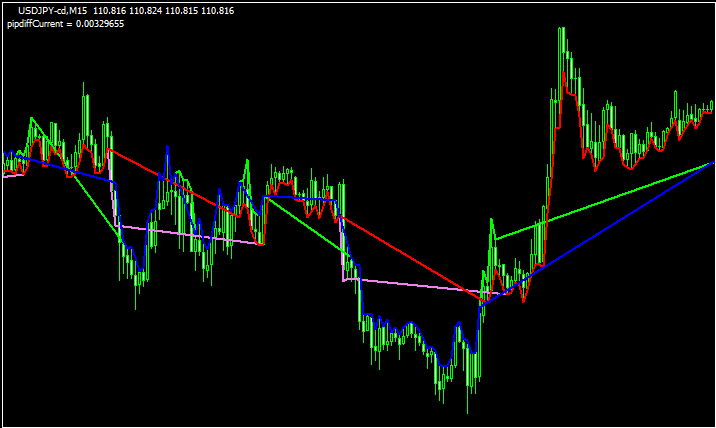 ラインタイプ
MACDをベースにサポレジラインが引かれる?「Macd_Support_and_Resistance」
 ラインタイプ
V字反転を狙う面白インジ「FMCBR」
 ラインタイプ
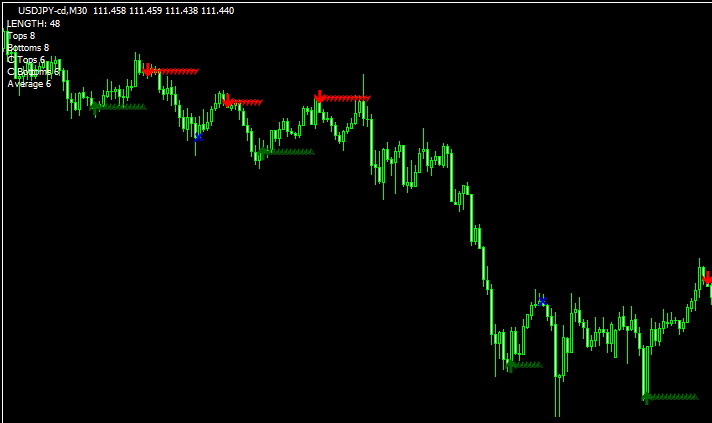
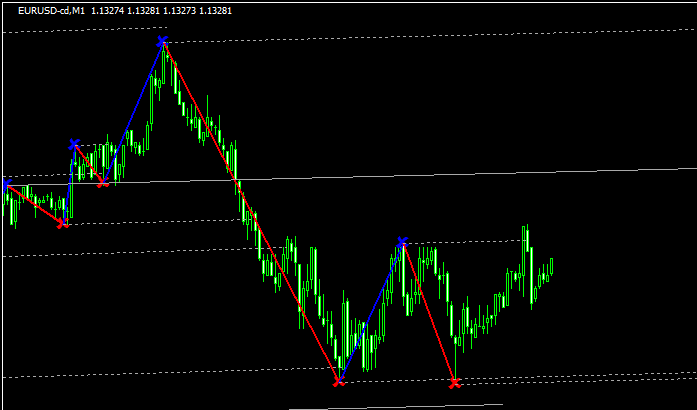
相場の波の頂点と底を分かりやすく示す「Wave_Arrows」
 ラインタイプ
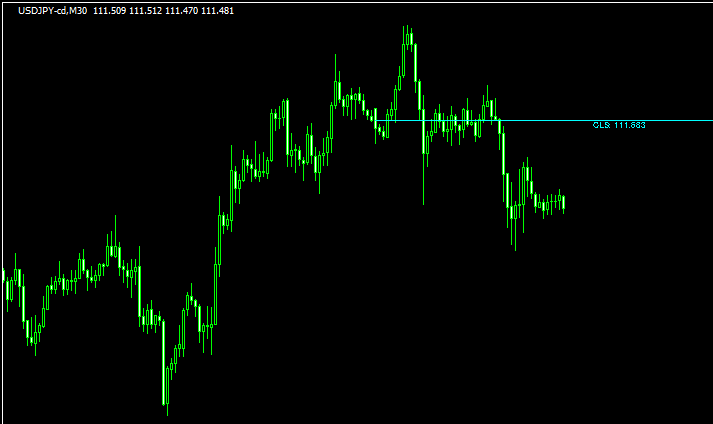
前日の終値が一目で分かる「previous_close」
 ラインタイプ
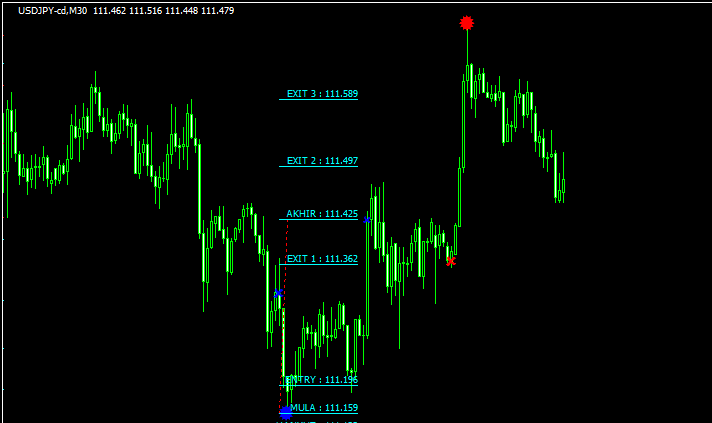
ラインタイプのちょっと変わったインジ「level_trading_123」
 ラインタイプ
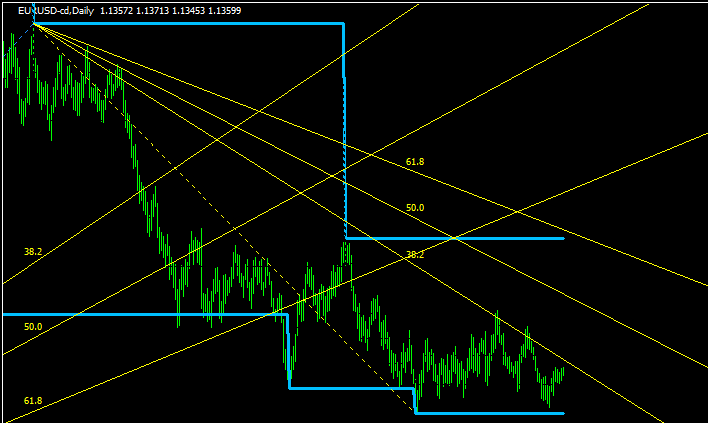
ピボットにフィボナッチを適用させた「fibo pivots alerts levels」
 ラインタイプ
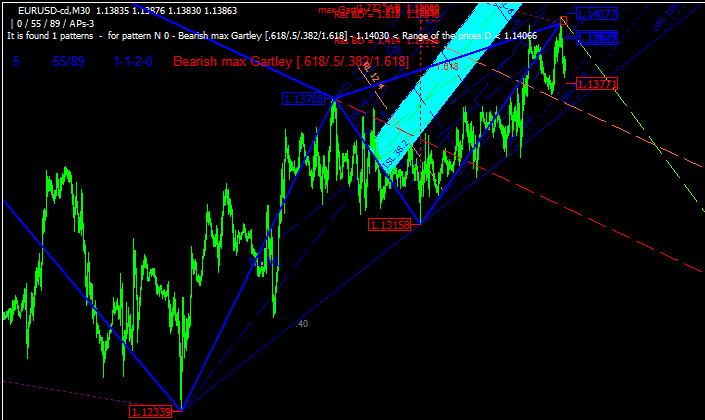
とにかく色々と凄い!「ZUP_v149」
 ラインタイプ
チャネルとフィボナッチファンが描画される「rvmFractalsLevel」
 ラインタイプ
ライントレードを見事にツール化した「マーケティングFX」
 ラインタイプ
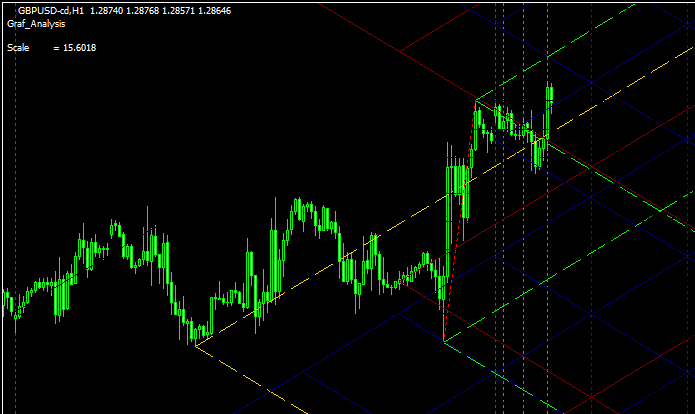
無数の菱形を形成するラインが描画される「Graf_Analysis」
 ラインタイプ
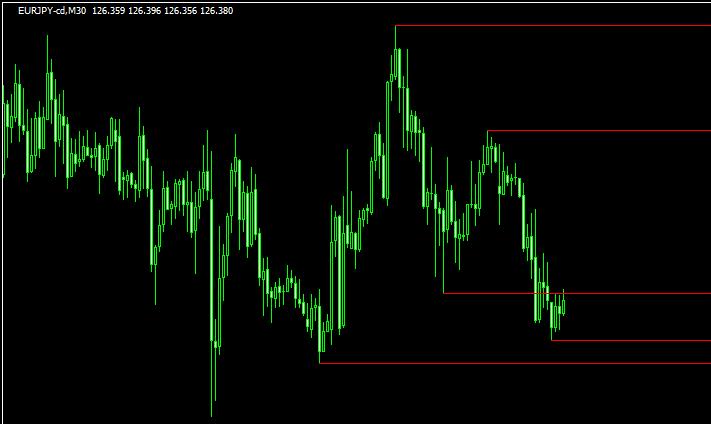
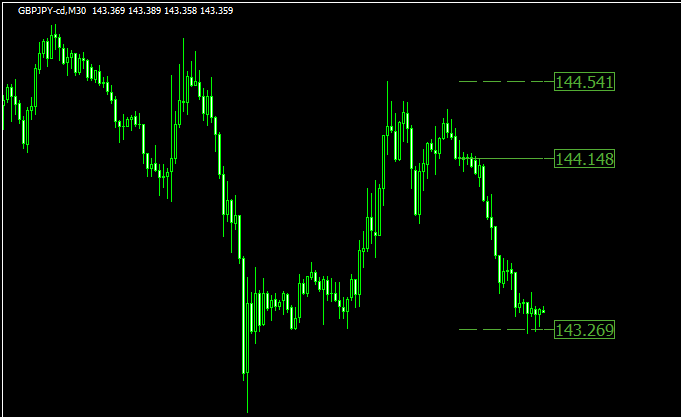
前日の高値と安値と終値を表示する「common_sr」
 ラインタイプ
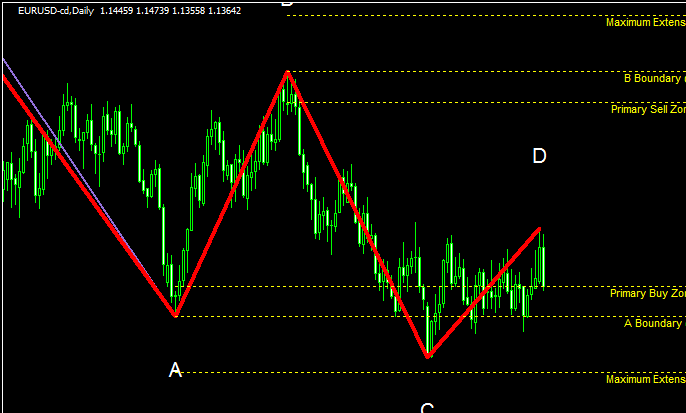
相場の波と売り買いのゾーンが分かる「Barros_Swing_Fix」
勝てる手法10個+超凄いインジをプレゼント!

\初心者から上級者まで大注目!/
当サイト限定で、XMの口座開設をすると「Forex Standard Club XM版」へ無料招待!
✔️ 期間限定で13,000円のボーナス!
✔️ 最大500ドルまで100%入金ボーナス!
✔️ 勝率を上げるトレード手法&限定インジケーターを多数提供!
将来の動きを予測する無料ツール差し上げます

未来予測インジケーター「Futuro FX」は、過去の動きと現在の動きの相関から少し先の動きを予測します。メルマガ登録で詳しい解説書をプレゼント!
さらにウォルフ波動を使ったトレード手法解説と本当に使えるウォルフ波動を認識するインジケーターもメルマガ内でご紹介します!
\初心者から上級者まで大注目!/
当サイト限定で、XMの口座開設をすると「Forex Standard Club XM版」へ無料招待!
✔️ 13,000円のボーナス!
✔️ 最大1000ドルまで100%入金ボーナス!
✔️ 勝率を上げるトレード手法&限定インジケーターを多数提供!