
 オシレーター
サブチャート
オシレーター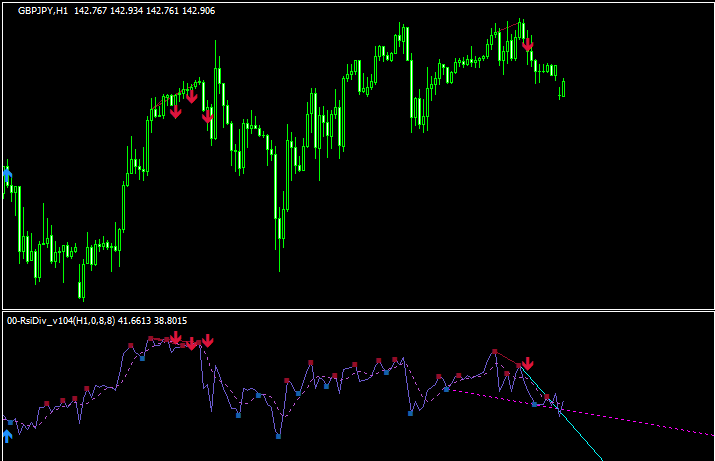 オシレーター
RSIのダイバージェンスを示し、トレンドラインも引く「00-RsiDiv_v104」
 相場状況表示
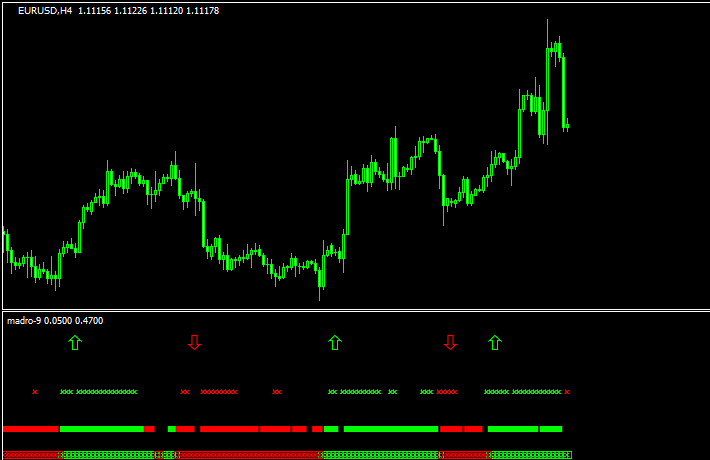
エントリーフィルターとして利用できる「Madro Golden_Filter」
 オシレーター
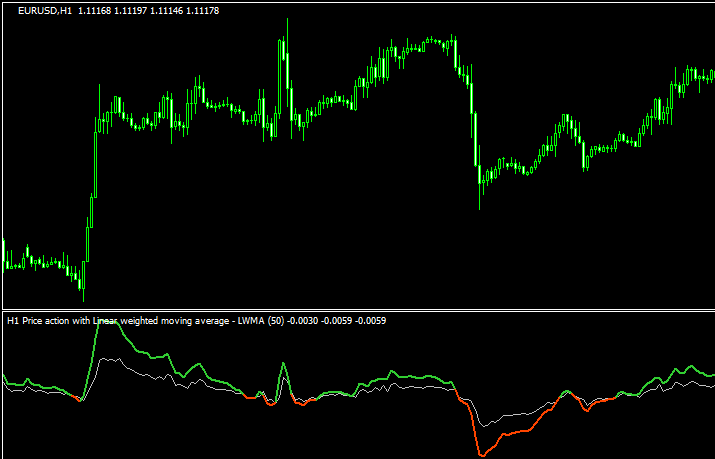
プライスアクションの平均?「Price action averages (mtf + alerts)」
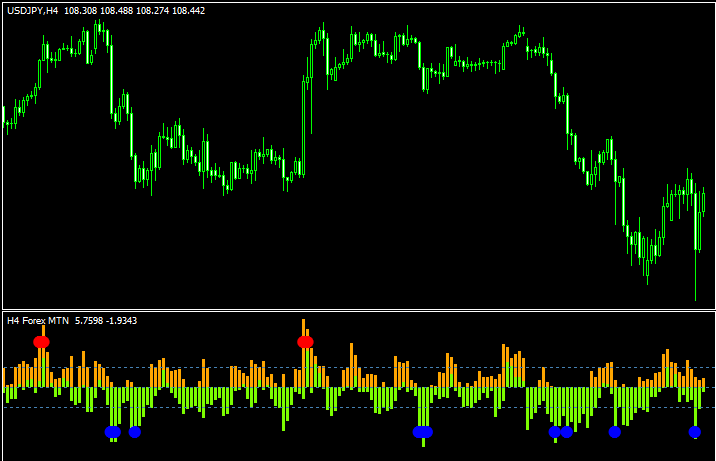 オシレーター
相場の行きすぎをドットで示す「forexmtn (mtf + alerts + arrows)」
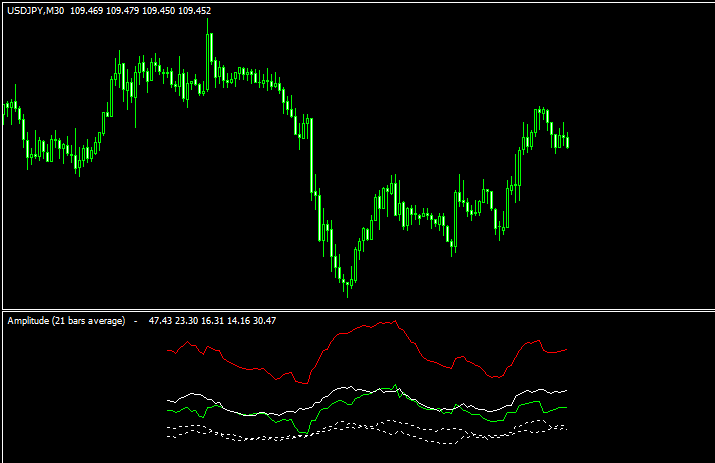 オシレーター
ローソク足の値幅の平均が表示される「amplitude-indicator」
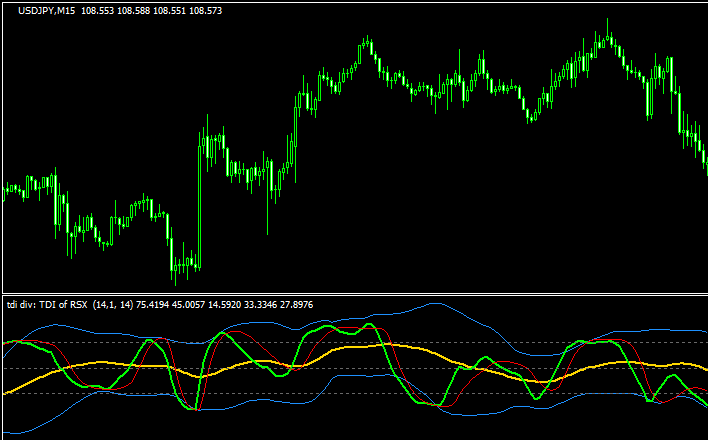 オシレーター
TDIスムーズドが表示できてダイバージェンスも分かる「TDI smoothed alerts + divergence」
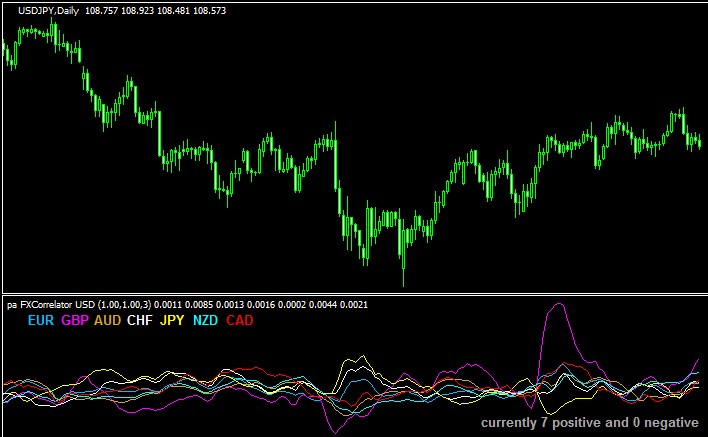 相場状況表示
ドルに対して相関があるかないかを示す「pa_fxcorrelator_3.1_usd」
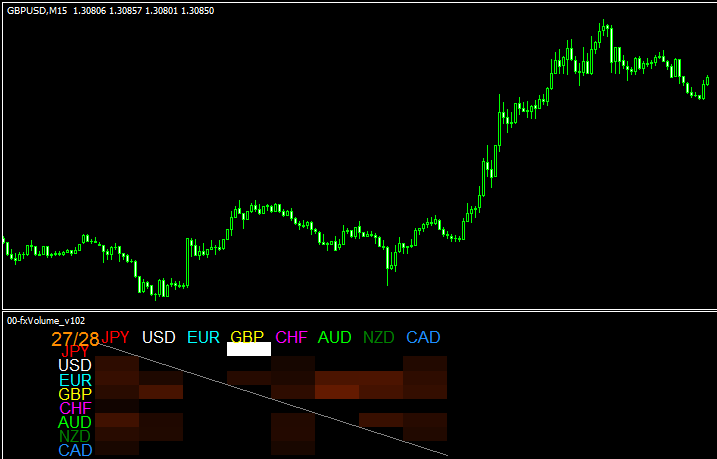 Volume
Volumeのある通貨ペアが一目で分かる「00-fxVolume_v102」
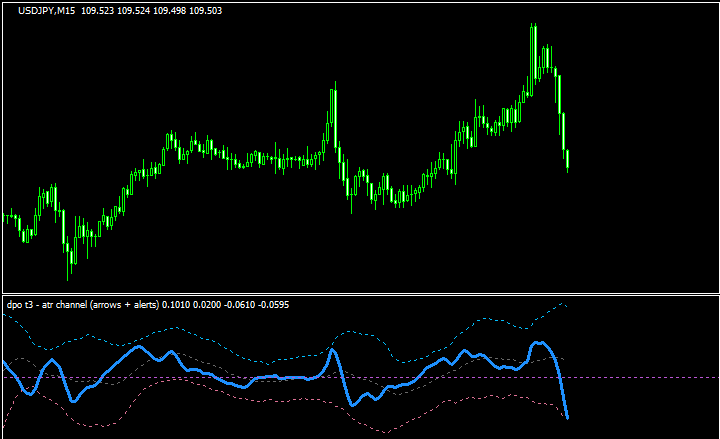 オシレーター
DPOをT3化してATRバンドも表示できる「dpo t3 – atr channel (arrows + alerts)」
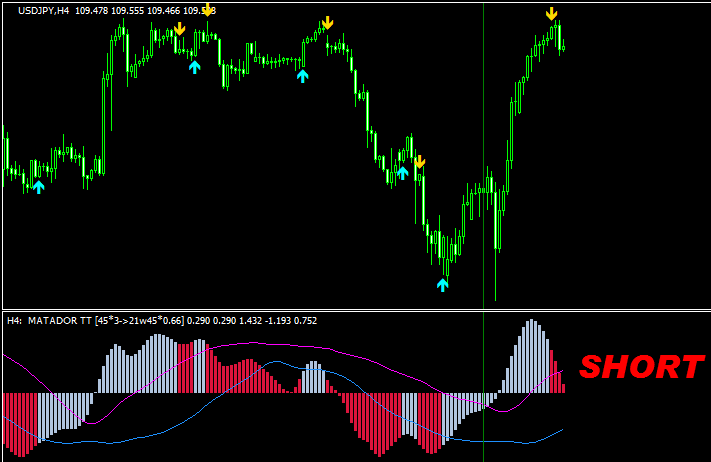
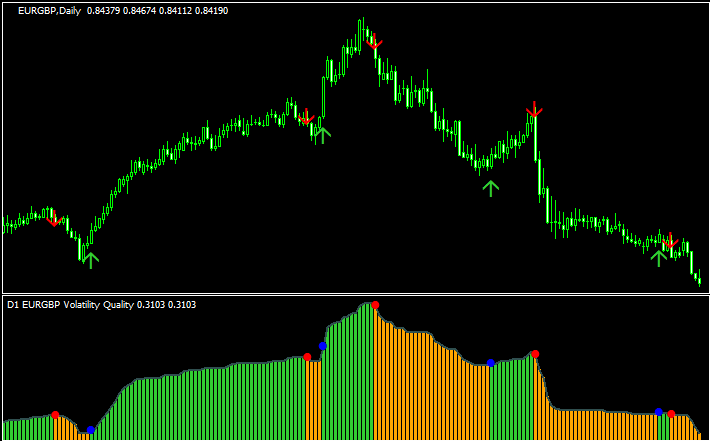 オシレーター
マルチタイム機能が付いてサインも出るVQ「Volatility quality histo mtf arrows – lines multisymbol 2.02」
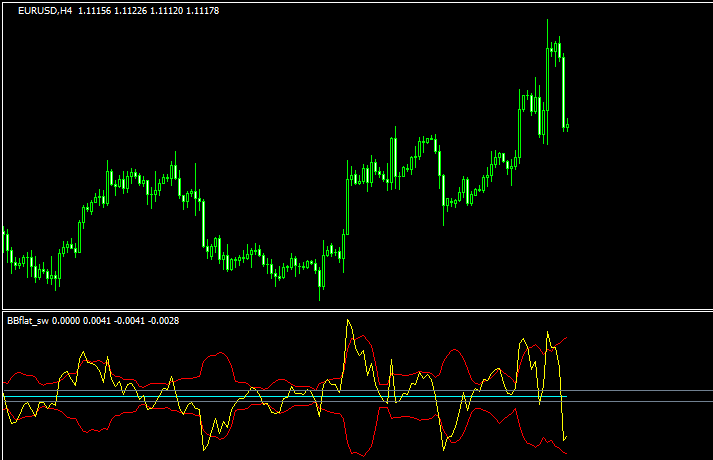 オシレーター
ボリバンをフラットに表示する「BBflat_sw」
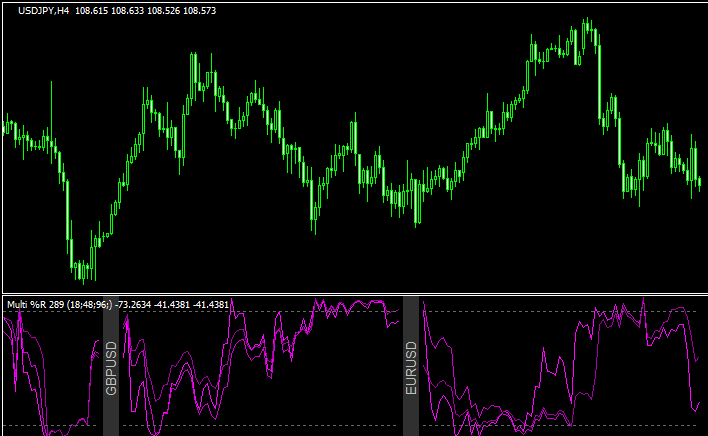 オシレーター
複数の通貨ペアでWPRを表示する「multi_pair_wpr」
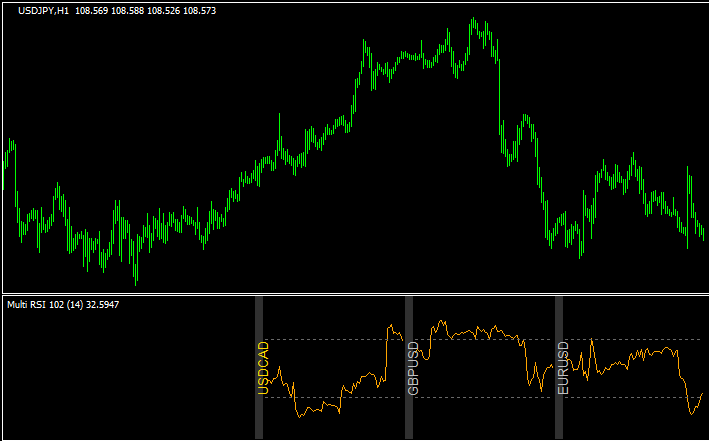 オシレーター
マルチペアのRSIを表示する「multi_pair_rsi」
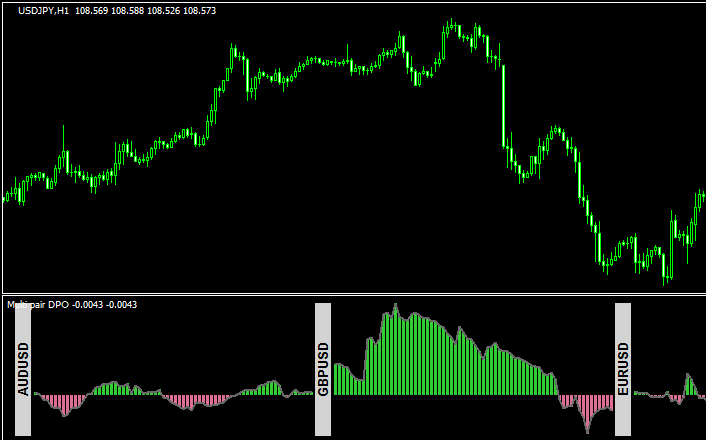 オシレーター
マルチペアでDetrended Price Oscillatorを表示する「multi_pair_dpo_nmc」
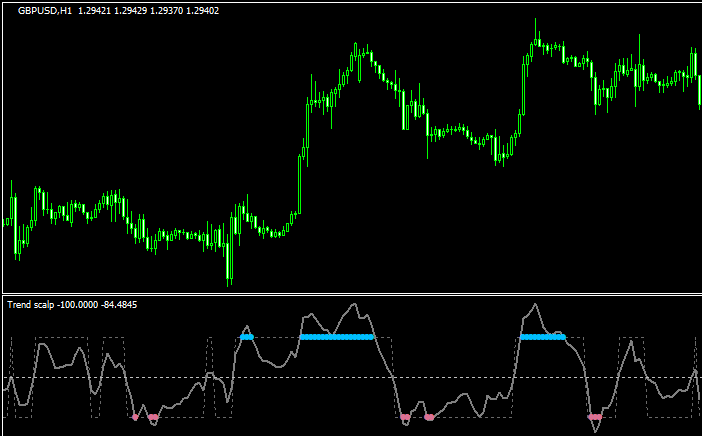 オシレーター
相場の売られすぎ・買われすぎが分かりやすい「Trend scalp」
勝てる手法10個+超凄いインジをプレゼント!

\初心者から上級者まで大注目!/
当サイト限定で、XMの口座開設をすると「Forex Standard Club XM版」へ無料招待!
✔️ 期間限定で13,000円のボーナス!
✔️ 最大500ドルまで100%入金ボーナス!
✔️ 勝率を上げるトレード手法&限定インジケーターを多数提供!
将来の動きを予測する無料ツール差し上げます

未来予測インジケーター「Futuro FX」は、過去の動きと現在の動きの相関から少し先の動きを予測します。メルマガ登録で詳しい解説書をプレゼント!
さらにスマートマネーコンセプト(SMC)について解説したPDFもプレゼント!
\初心者から上級者まで大注目!/
当サイト限定で、XMの口座開設をすると「Forex Standard Club XM版」へ無料招待!
✔️ 13,000円のボーナス!
✔️ 最大1000ドルまで100%入金ボーナス!
✔️ 勝率を上げるトレード手法&限定インジケーターを多数提供!