
 オシレーター
MTF
オシレーター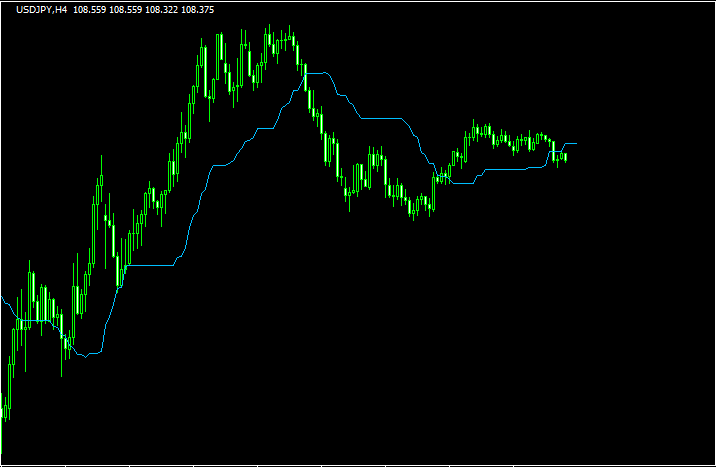 ラインタイプ
マルチタイムで基準線が表示される「kijun-sen limit bars」
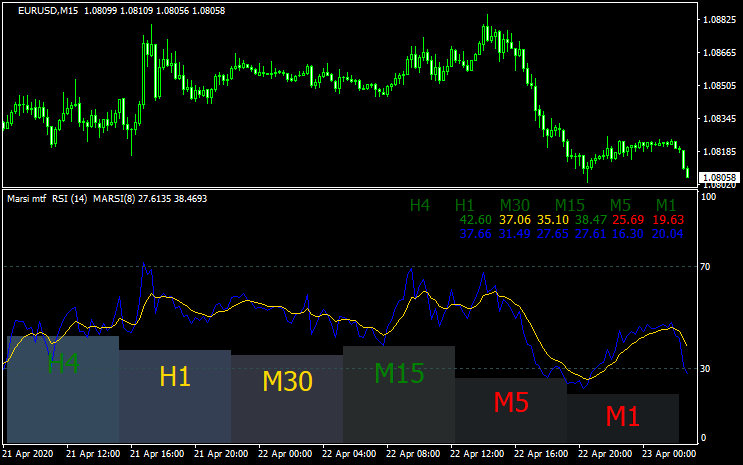 オシレーター
マルチタイムでMA化したRSIが見える「Marsi mtf」
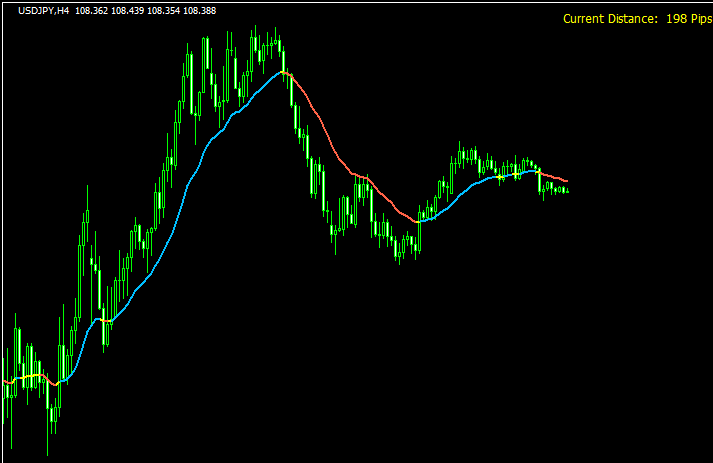
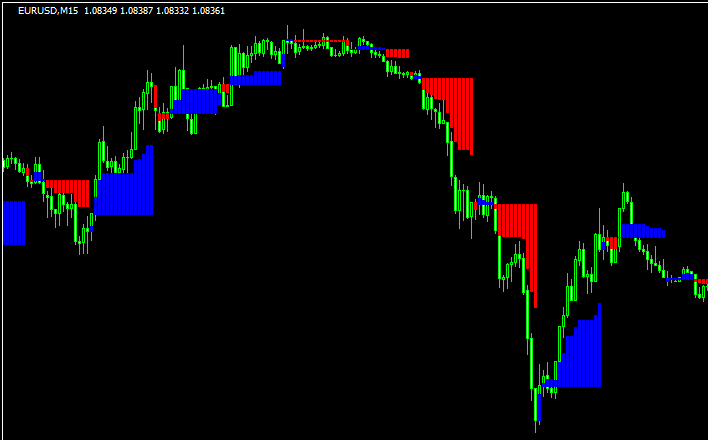 トレンド表示型
相場の勢いが視覚的にわかりやすい「dwebPriceTrend」
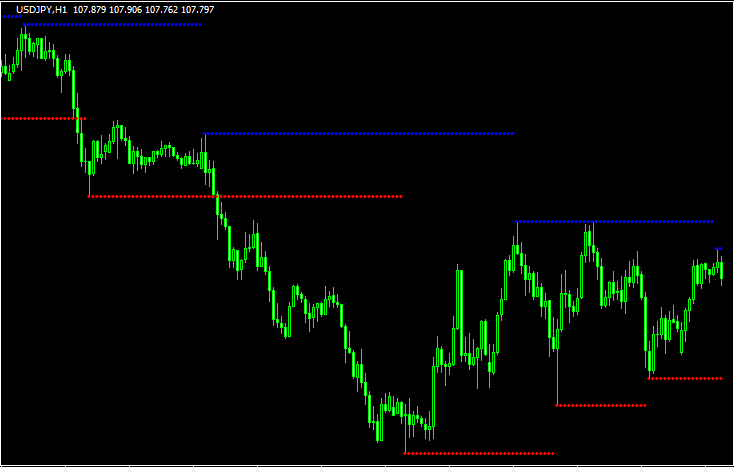 SMC
SMCマルチタイムに対応し、頂点から水平線が引かれるジグザグ「zigzagtriad-mtf+alerts2」
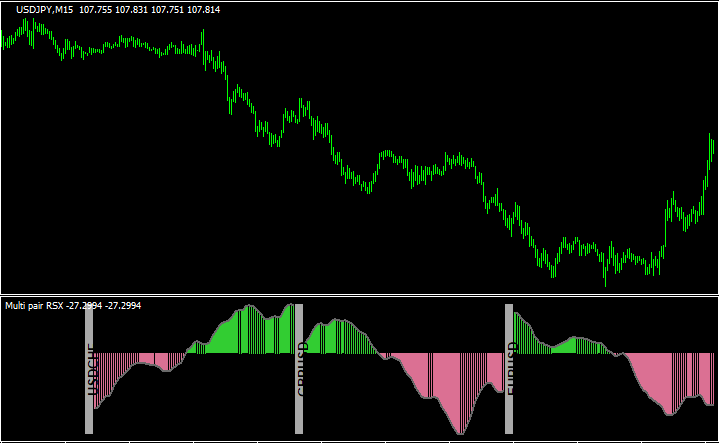
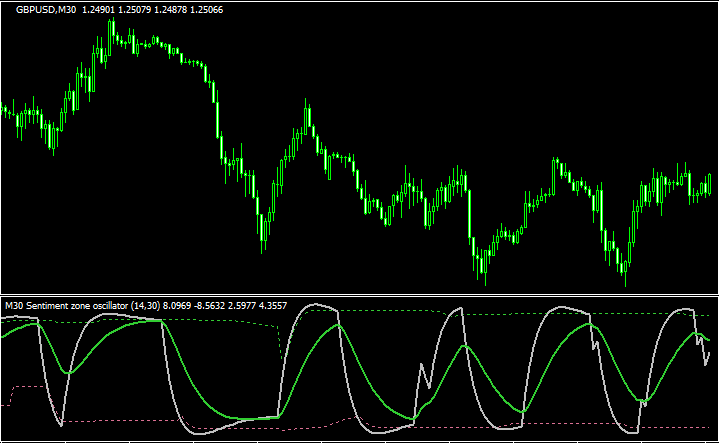 オシレーター
2つの期間のセンチメントゾーンオシレーターを表示する「sentiment-zone-oscillator」
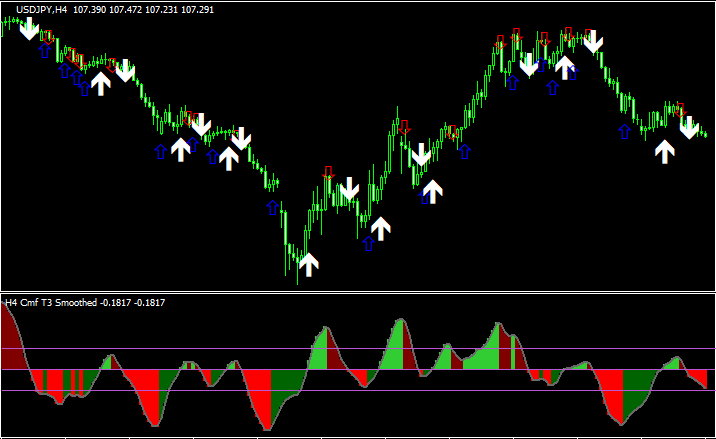 オシレーター
チャイキン・マネー・フローベースとした「Chalkin Money Flow Teamtrader」
 ローソク足
ローソク足上位のローソク足を重ねて表示する「BTF Candle」
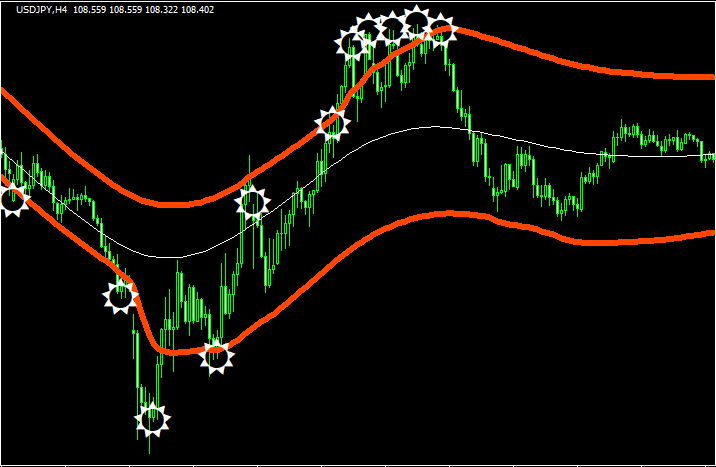 バンドタイプ
利食いの参考になる「TARGET BANDS」
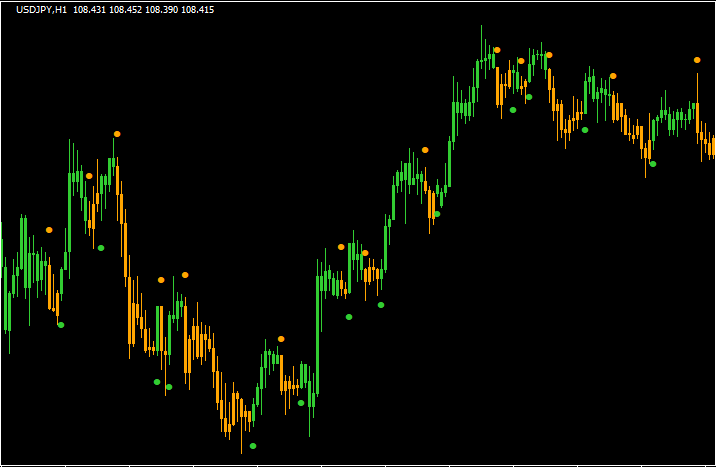 トレンド表示型
ASCTrendのトレンド方向によってローソク足の色が変わる「labtrend_v_4.03」
 ラインタイプ
様々な種類のMAを表示できる「AllAverages_v2.5_Dist_Up_Dn_alert」
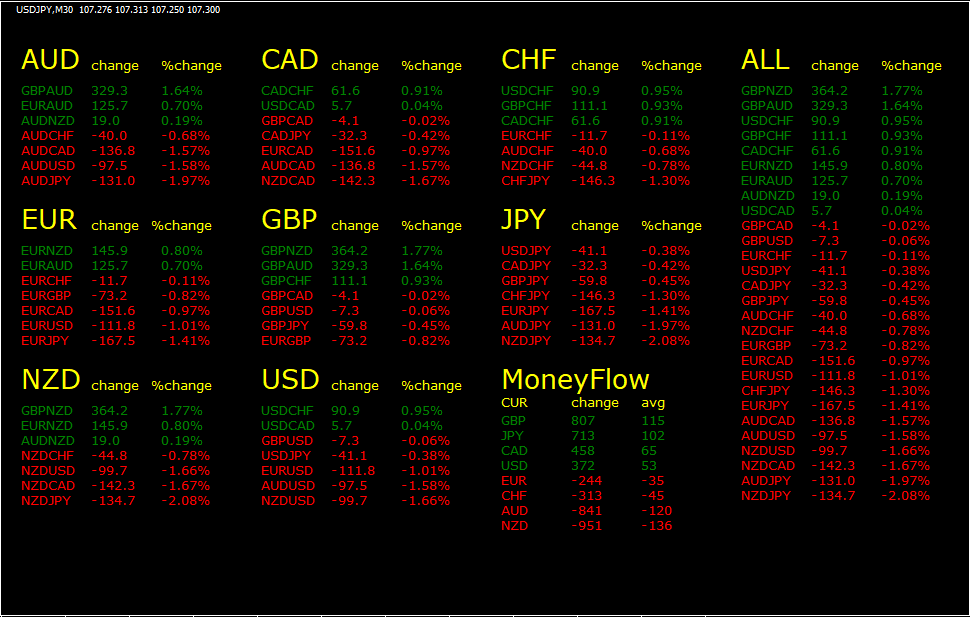 相場状況表示
各通貨ペアの変動率や値幅が一覧で表示される「PairsPercentChange」
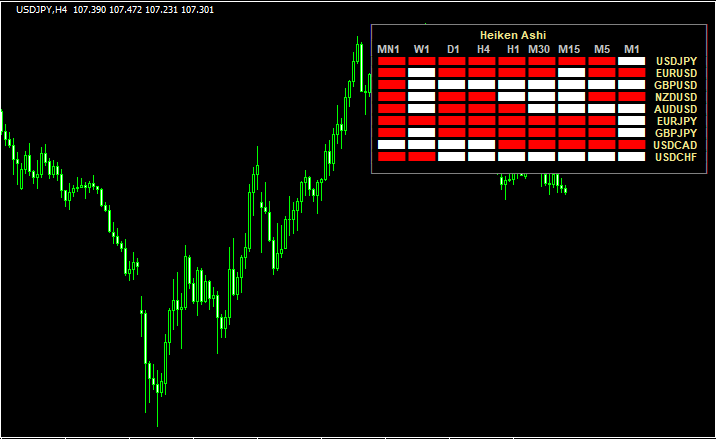 相場状況表示
マルチ通貨ペア&マルチタイムで平均足の状況を表示する「MTF Multi Signal Multi Pair HA v2」
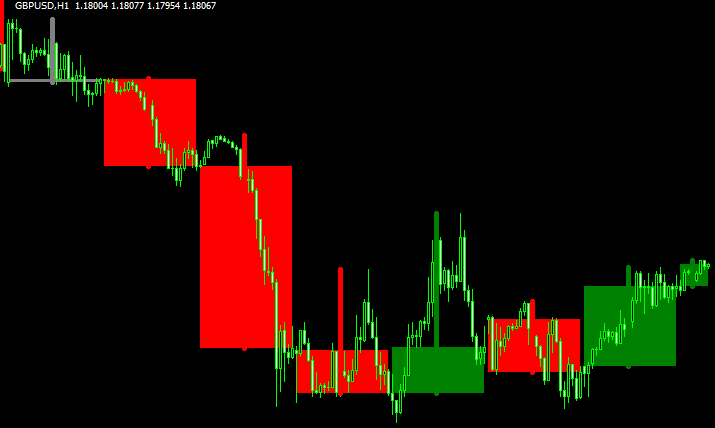
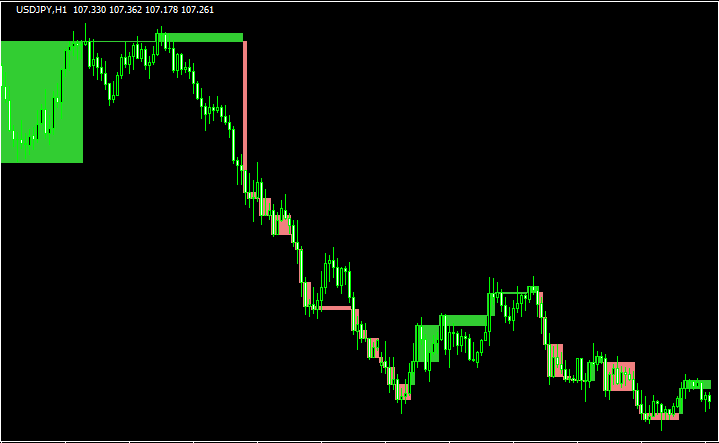 ボックス
ボックスレンジからのブレイクが狙える「UniLineBreak_v2.5」
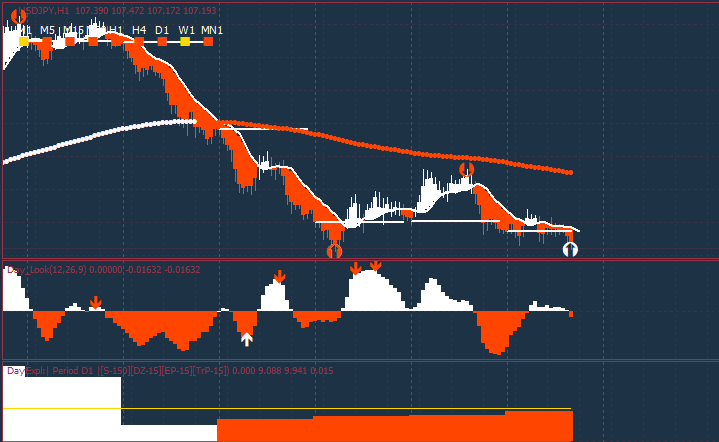 平均足
平均足平均足をベースとしたトレンドフォロー用のインジ群
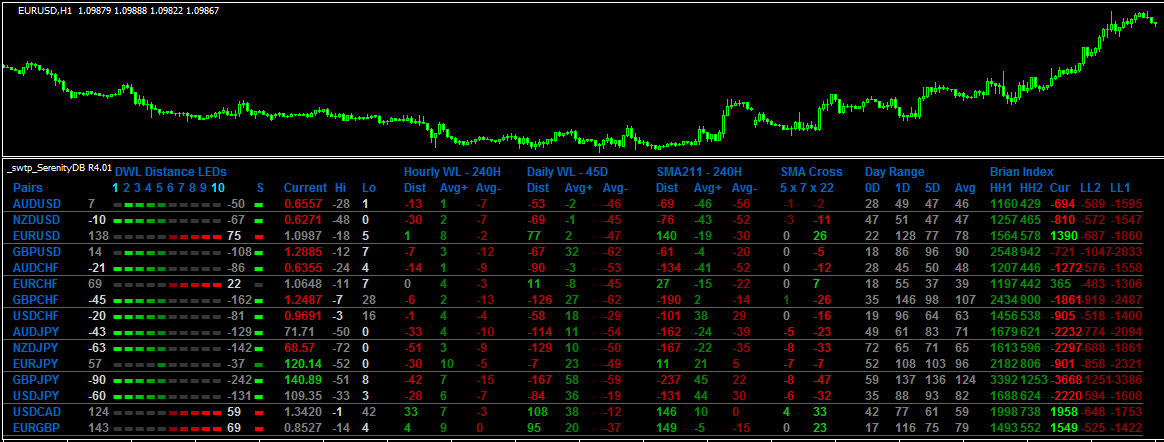 相場状況表示
相場の状況が一覧で示される「_tp SerenityDashBoard R4.01」
勝てる手法10個+超凄いインジをプレゼント!

\初心者から上級者まで大注目!/
当サイト限定で、XMの口座開設をすると「Forex Standard Club XM版」へ無料招待!
✔️ 期間限定で13,000円のボーナス!
✔️ 最大500ドルまで100%入金ボーナス!
✔️ 勝率を上げるトレード手法&限定インジケーターを多数提供!
将来の動きを予測する無料ツール差し上げます

未来予測インジケーター「Futuro FX」は、過去の動きと現在の動きの相関から少し先の動きを予測します。メルマガ登録で詳しい解説書をプレゼント!
さらにスマートマネーコンセプト(SMC)について解説したPDFもプレゼント!
\初心者から上級者まで大注目!/
当サイト限定で、XMの口座開設をすると「Forex Standard Club XM版」へ無料招待!
✔️ 13,000円のボーナス!
✔️ 最大1000ドルまで100%入金ボーナス!
✔️ 勝率を上げるトレード手法&限定インジケーターを多数提供!