
 ラインタイプ
MTF
ラインタイプ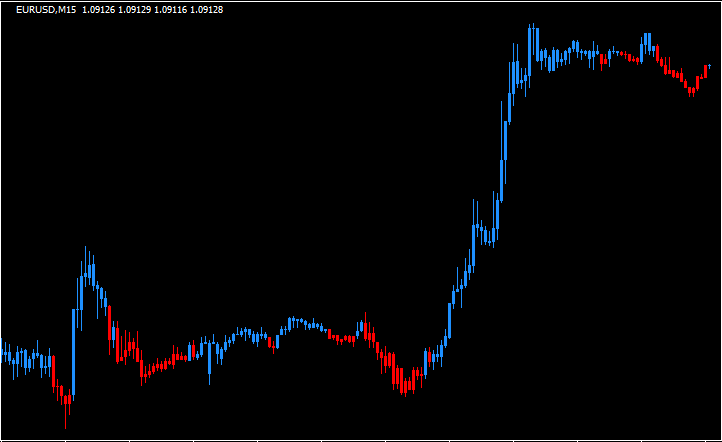 ローソク足
ローソク足価格とMAの位置関係で足の色が変わる「Averages – candles (mtf)」
 ラインタイプ
ATRを利用した2本のラインが表示される「ChandeKroll_Stop_v2.0」
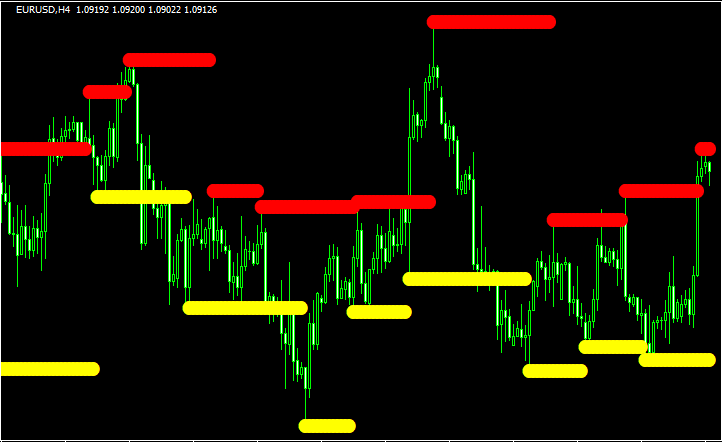
 バンドタイプ
BBstopに少し似た「NRTR_Rosh_v2eAlert_mtf_nmc」
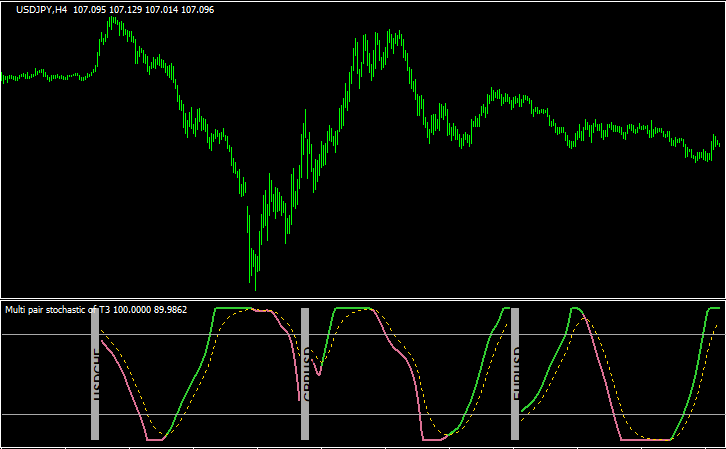 オシレーター
マルチ通貨ペアでT3ストキャスティクスを表示する「multi_pair_stochastic_of_t3_nmc」
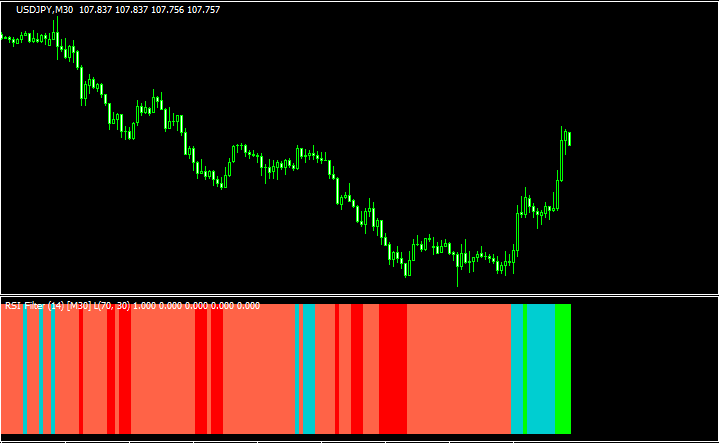 バータイプ
バータイプRSIの状況をバーで示す多機能インジ「RSI_Filter_vX2D2alert_mtf」
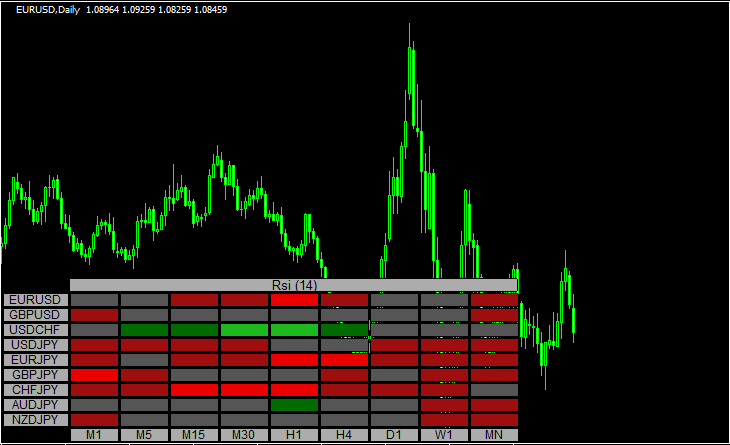 相場状況表示
マルチタイム&マルチ通貨ペアでRSIの状況を示す「Rsi heatmap 1_1」
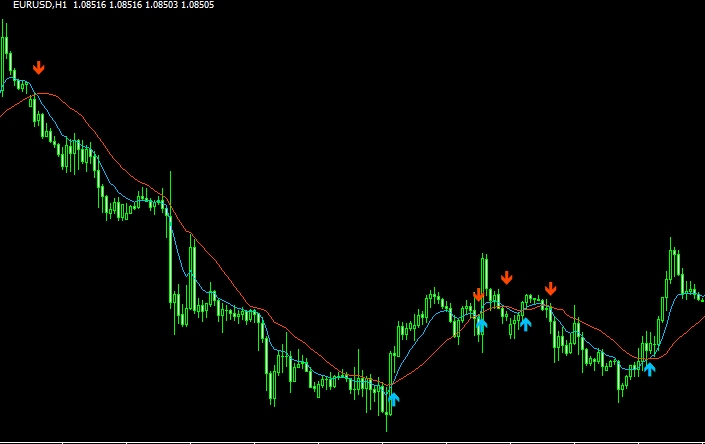 移動平均線タイプ
マルチタイムでMAのクロスオーバーを表示できる「AllAveragesCrossover_v1.1」
 便利ツール
便利ツールキーを押すだけで時間足を変更できる「Change Time Frame Indicator」
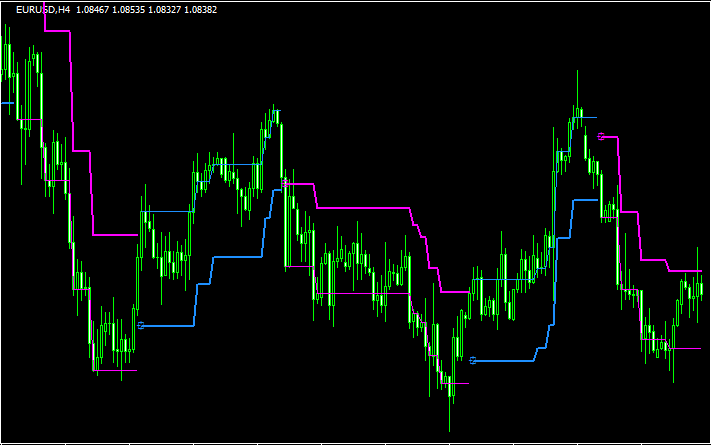
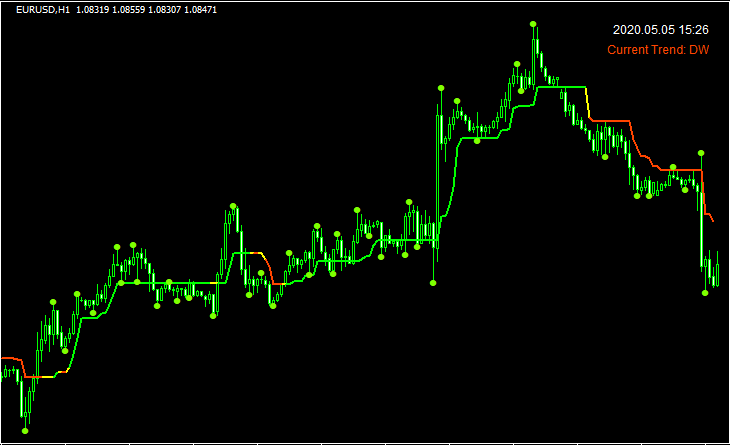
 バンドタイプ
BBストップのMTF版「BBands stop v3 MTF + limited bars」
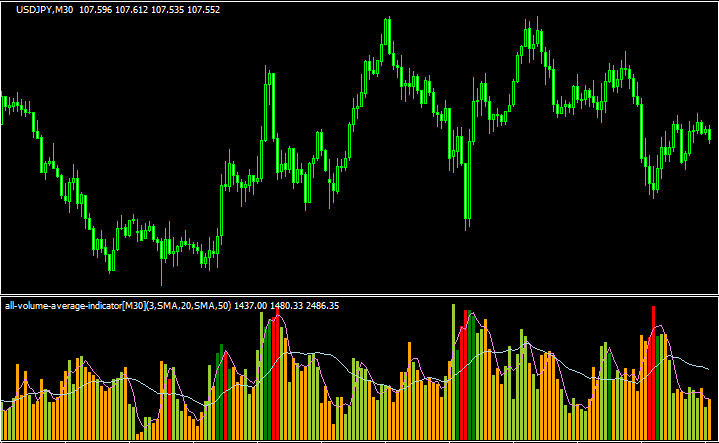 Volume
マルチタイムに対応したボリューム「all-volume-average-indicator」
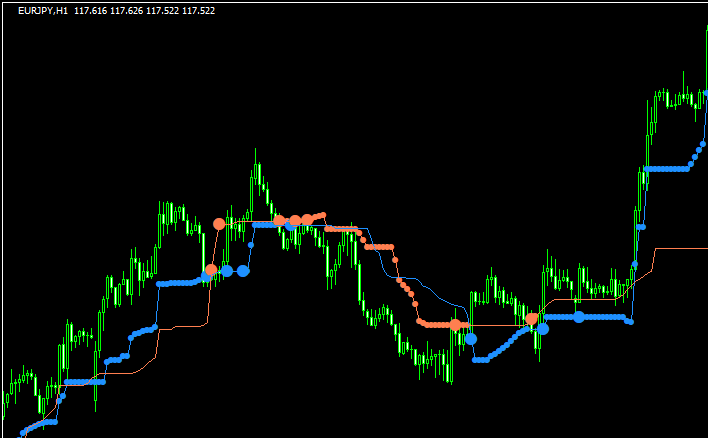
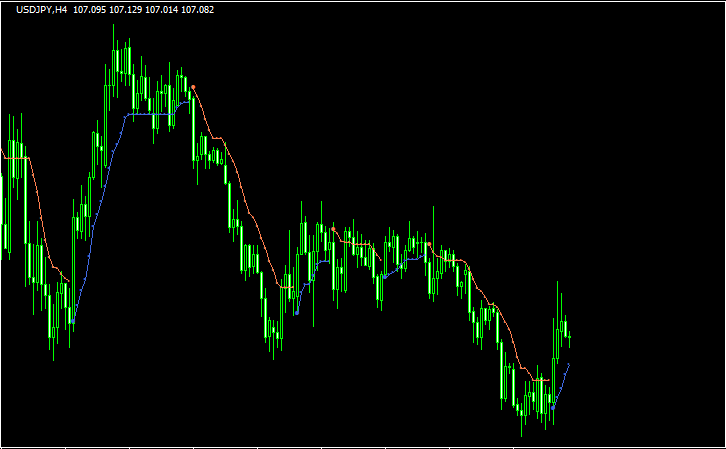
 ラインタイプ
相場のトレンド方向を明確に表示する「WORMHOLE TrendWinMTF」
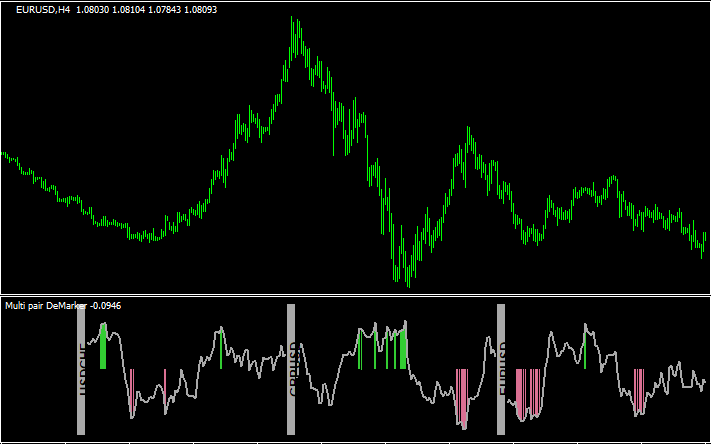 オシレーター
マルチ通貨ペアでデマーカーが表示される「multi_pair_demarker_nmc」
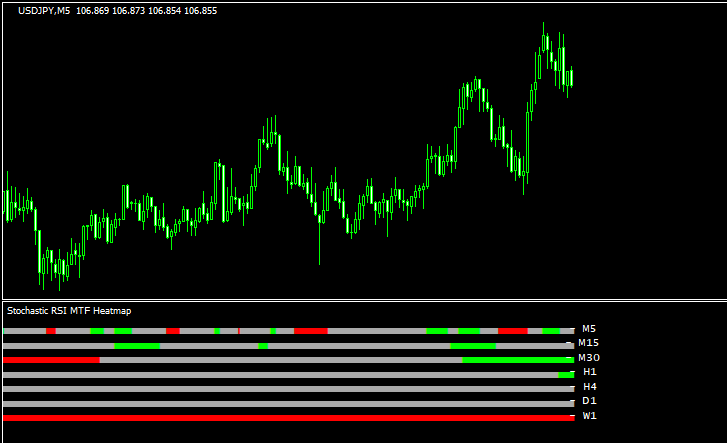 バータイプ
バータイプストキャスティクスRSIをバーで表示する「Stochastic_RSI_MTF_Heatmap」
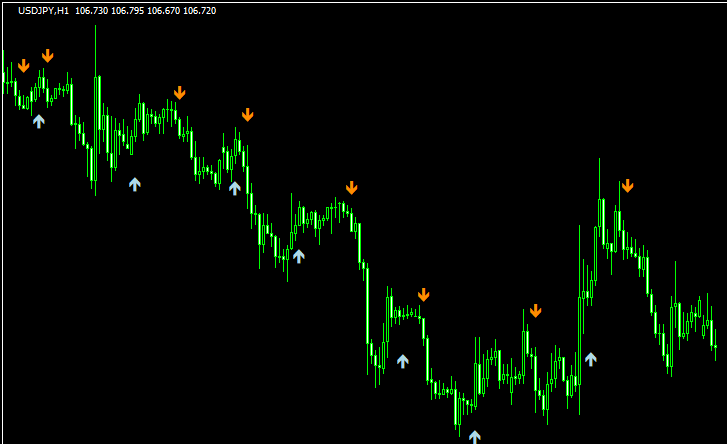 サインのみ
サインのみマルチタイムに対応したASCTrend「TrendSignal 2.31 mtf」
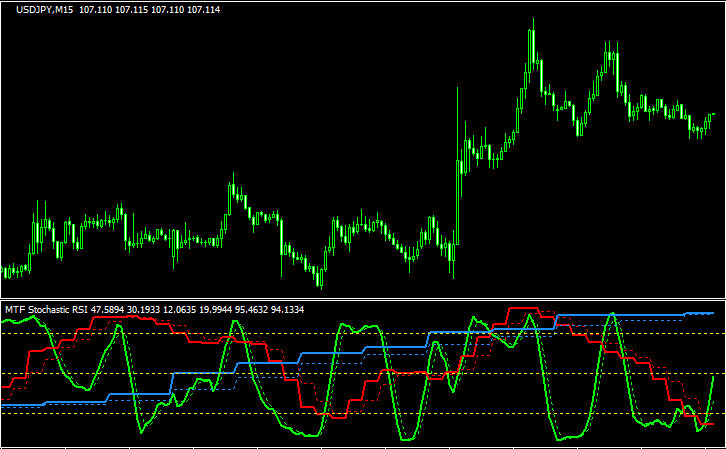 オシレーター
3つの時間足でストキャスティクスRSIを表示させる「MTF_Stochastic_RSI」
勝てる手法10個+超凄いインジをプレゼント!

\初心者から上級者まで大注目!/
当サイト限定で、XMの口座開設をすると「Forex Standard Club XM版」へ無料招待!
✔️ 期間限定で13,000円のボーナス!
✔️ 最大500ドルまで100%入金ボーナス!
✔️ 勝率を上げるトレード手法&限定インジケーターを多数提供!
将来の動きを予測する無料ツール差し上げます

未来予測インジケーター「Futuro FX」は、過去の動きと現在の動きの相関から少し先の動きを予測します。メルマガ登録で詳しい解説書をプレゼント!
さらにスマートマネーコンセプト(SMC)について解説したPDFもプレゼント!
\初心者から上級者まで大注目!/
当サイト限定で、XMの口座開設をすると「Forex Standard Club XM版」へ無料招待!
✔️ 13,000円のボーナス!
✔️ 最大1000ドルまで100%入金ボーナス!
✔️ 勝率を上げるトレード手法&限定インジケーターを多数提供!