
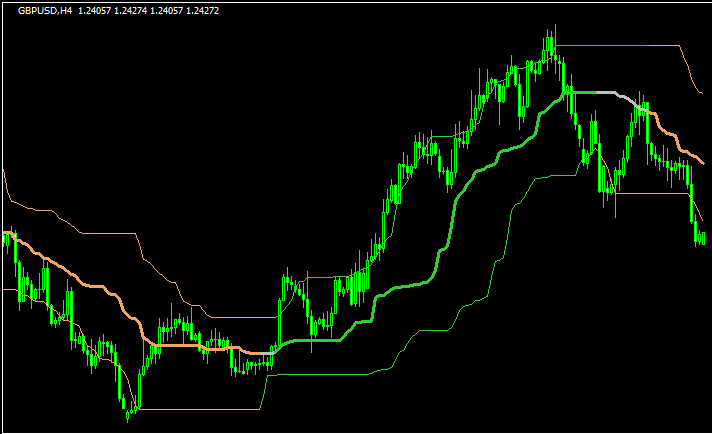
 バンドタイプ
MTF
バンドタイプ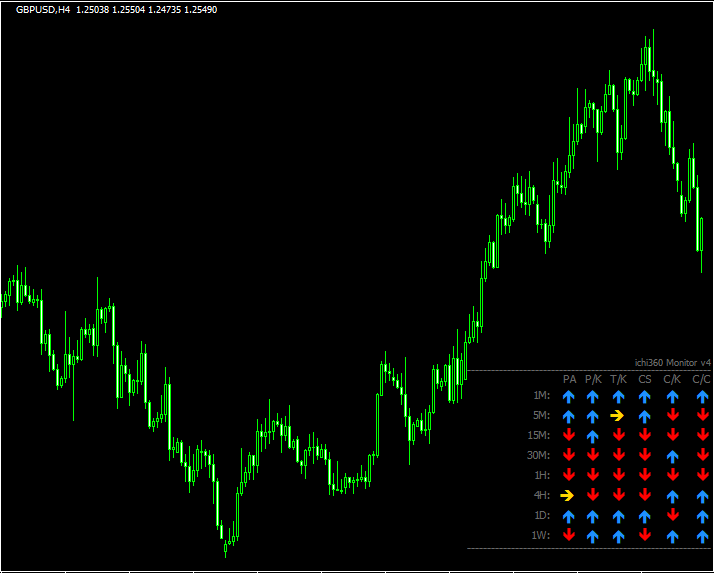 相場状況表示
一目均衡表の状況をマルチタイムで教えてくれる「ichi360 Monitor V4」
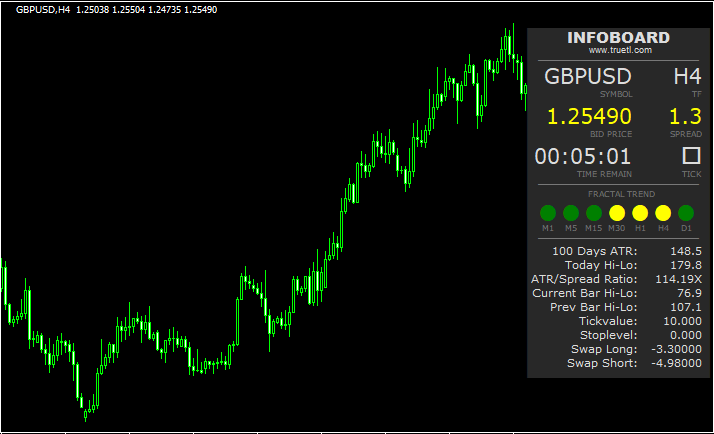 相場状況表示
相場の状況を見るのに使える「Infoboard」
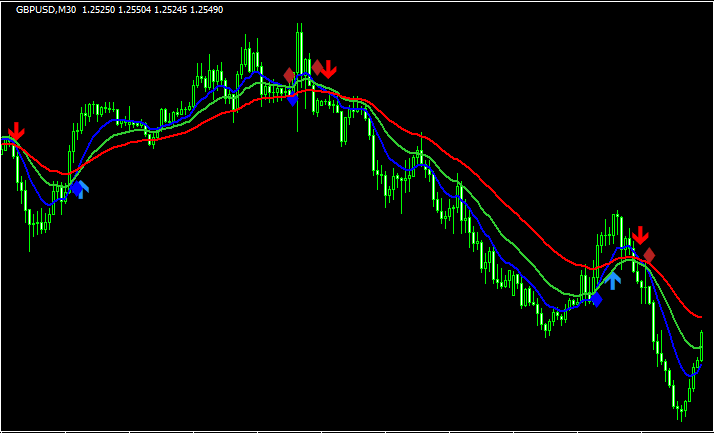
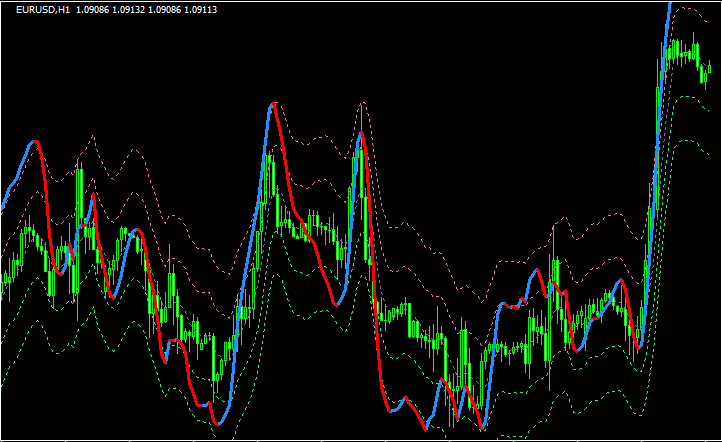 バンドタイプ
WPRを使用したバンド型インジ「WPR averages OnChart smooth arrows alerts」
 ラインタイプ
マルチタイムで3本のMAのクロスでサインを出す「3 MA Cross with alert mtf 3.03」
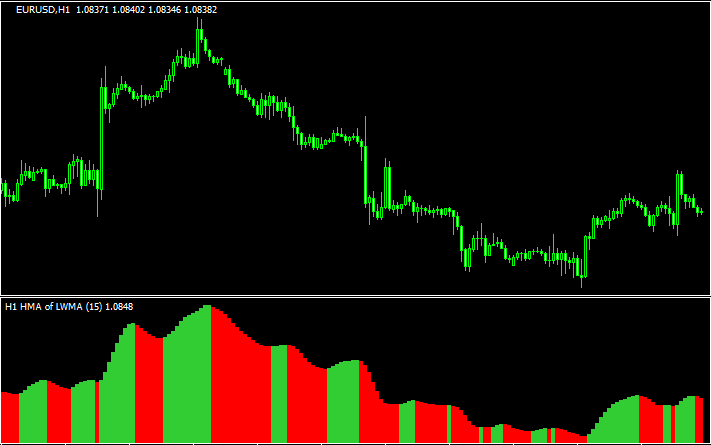 オシレーター
HMAをベースとしたヒストグラム「Hma averages – histo (mtf + alerts + lines)」
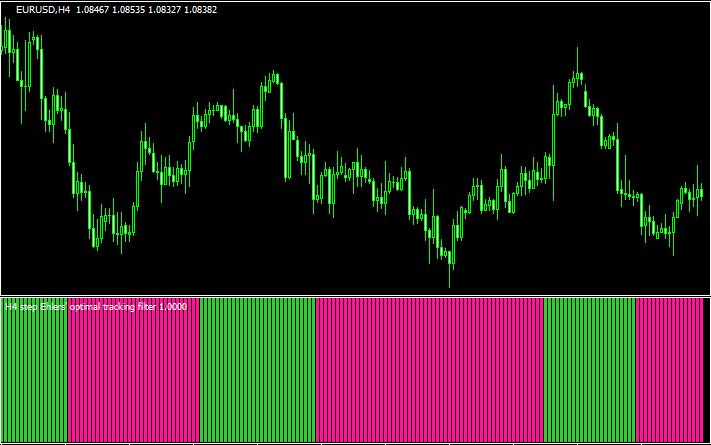 バータイプ
バータイプチャート下にトレンド方向を示す「step ehlers optimal tracking filter histo (mtf + alerts)」
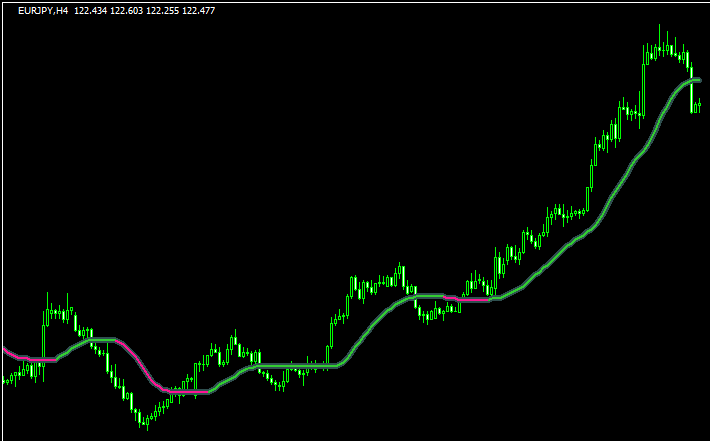 移動平均線タイプ
高性能なフィルタリングインジ「step ehlers optimal tracking filter (mtf + alerts + arrows)」
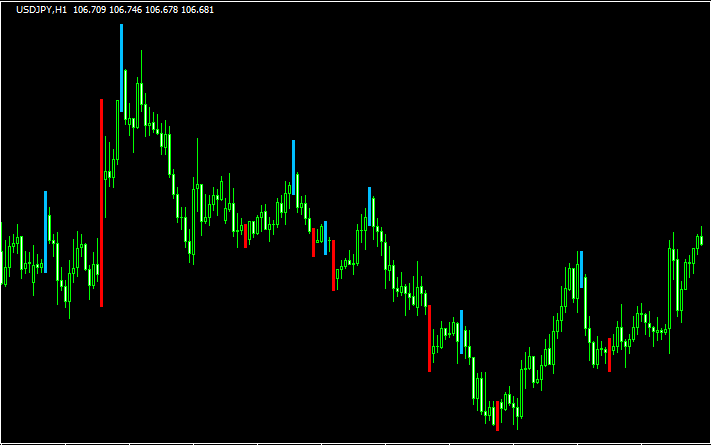 ローソク足
ローソク足相場のスイングポイントを見つける「ttm scalper with subswings 2.3」
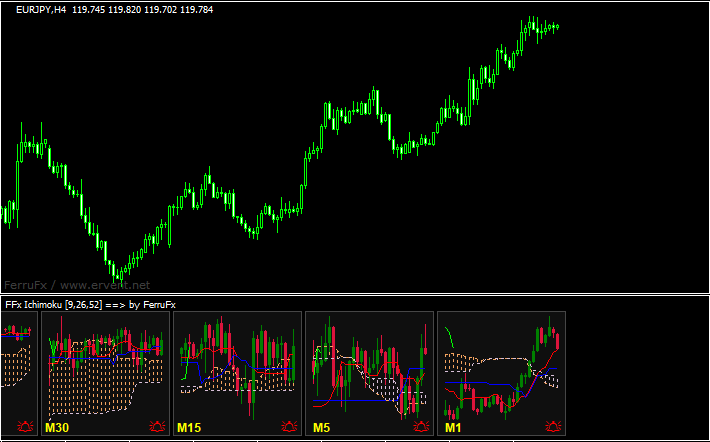 相場状況表示
マルチタイムで一目均衡表を表示する「FFx_IchimokuKinkoHyo」
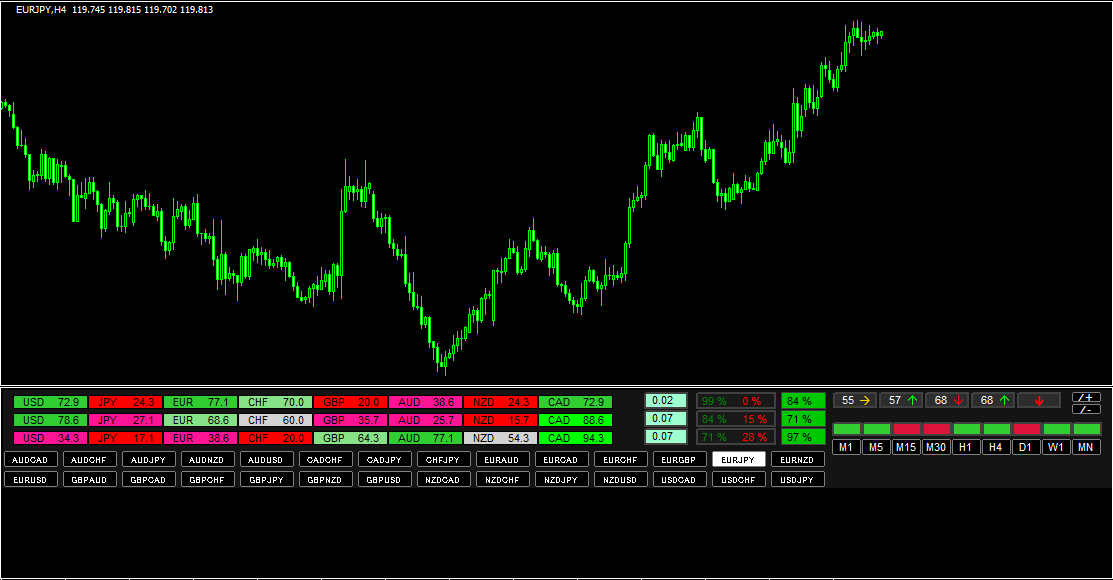 相場状況表示
マルチ通貨ペア、マルチタイムで様々な情報が表示される「Chart Button V2」
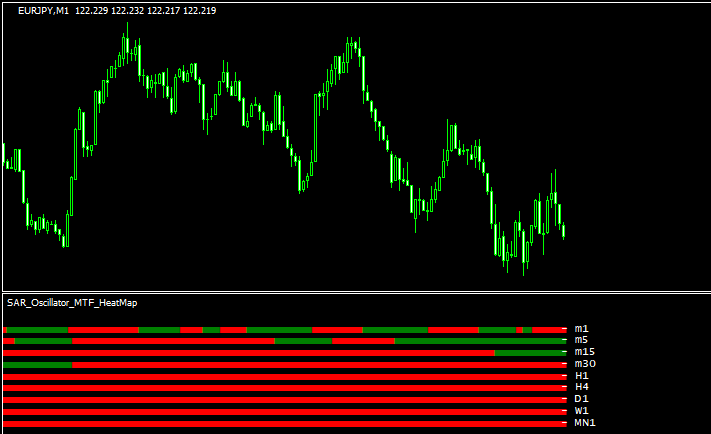 バータイプ
バータイプマルチタイムでパラボリックの状況を表示する「SAR_Oscillator_MTF_Heatmap」
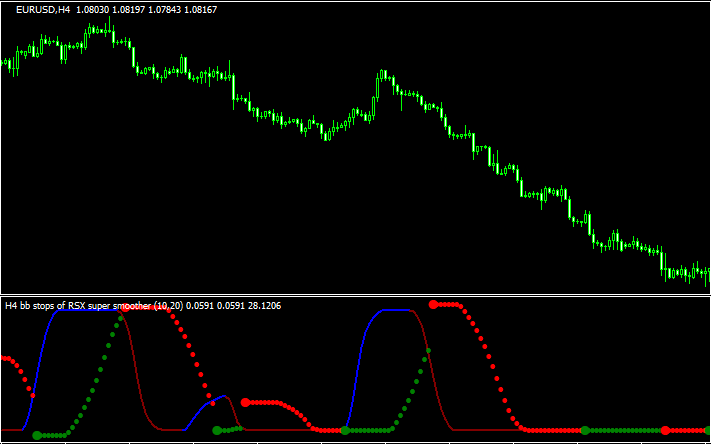 オシレーター
BBstops RSIのマルチタイム版「bb stops rsi super smooth mtf」
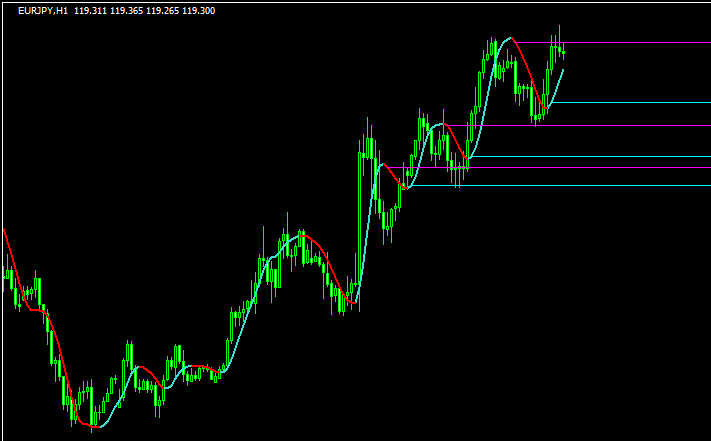 移動平均線タイプ
マルチタイムに対応したハル移動平均線「Hull Master Mtf Indicator」
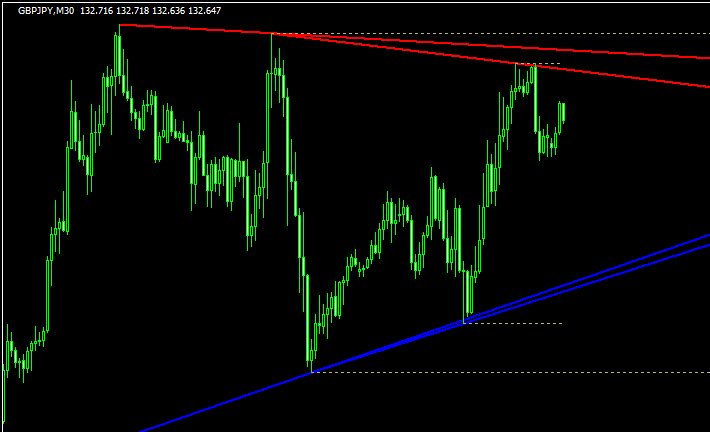 ラインタイプ
自動でトレンドラインを引いてくれる「Dadas_True_Trend_Indi_v3.4」
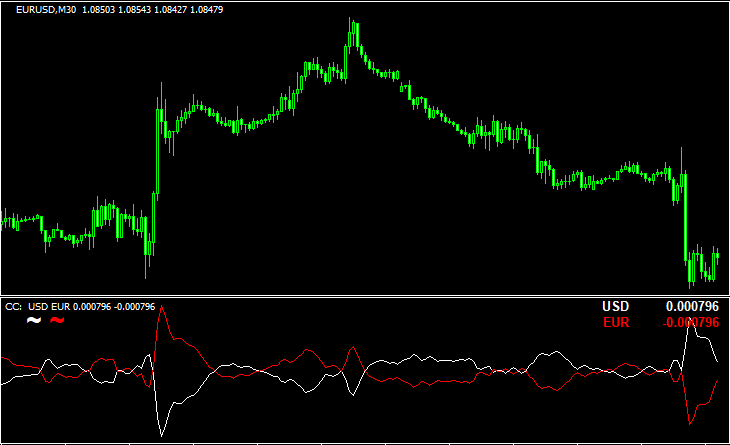 通貨強弱
通貨強弱通貨の強弱の推移を示す「CC mtf & alerts 2.03 nmc」
勝てる手法10個+超凄いインジをプレゼント!

\初心者から上級者まで大注目!/
当サイト限定で、XMの口座開設をすると「Forex Standard Club XM版」へ無料招待!
✔️ 期間限定で13,000円のボーナス!
✔️ 最大500ドルまで100%入金ボーナス!
✔️ 勝率を上げるトレード手法&限定インジケーターを多数提供!
将来の動きを予測する無料ツール差し上げます

未来予測インジケーター「Futuro FX」は、過去の動きと現在の動きの相関から少し先の動きを予測します。メルマガ登録で詳しい解説書をプレゼント!
さらにスマートマネーコンセプト(SMC)について解説したPDFもプレゼント!
\初心者から上級者まで大注目!/
当サイト限定で、XMの口座開設をすると「Forex Standard Club XM版」へ無料招待!
✔️ 13,000円のボーナス!
✔️ 最大1000ドルまで100%入金ボーナス!
✔️ 勝率を上げるトレード手法&限定インジケーターを多数提供!