
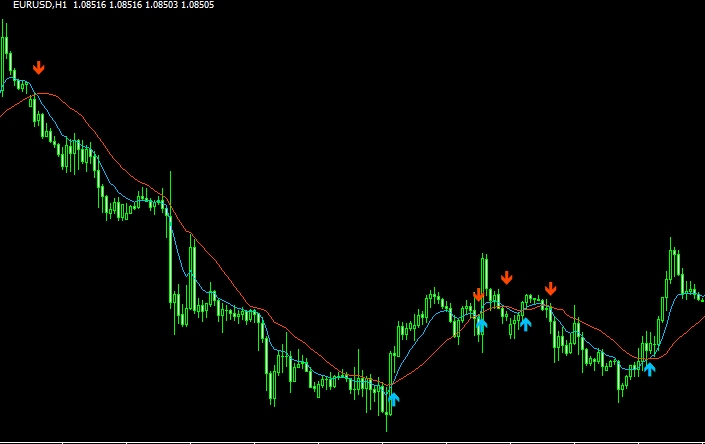
 移動平均線タイプ
シグナル
移動平均線タイプ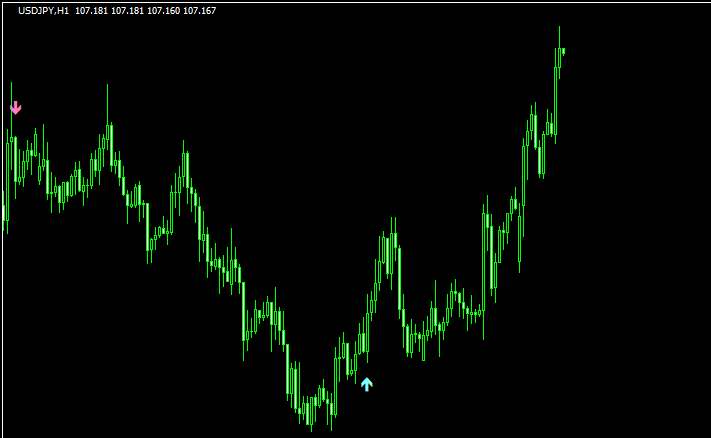 サインのみ
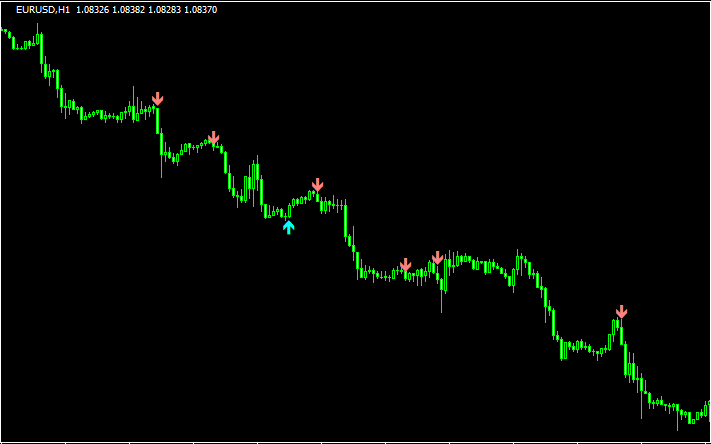
サインのみSchaffを利用したシグナルインジ「Schaff_signal」
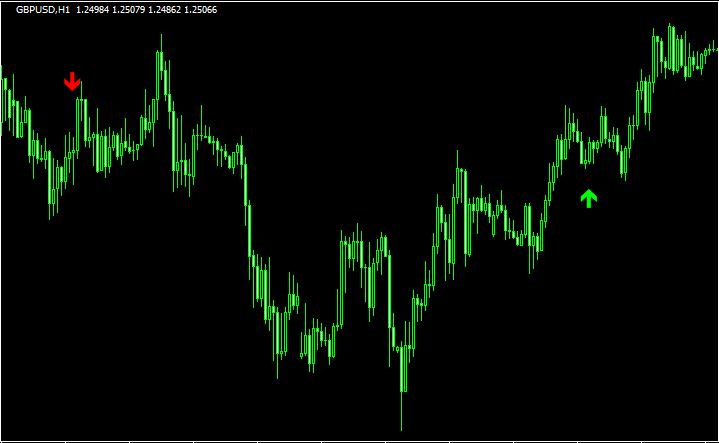 サインのみ
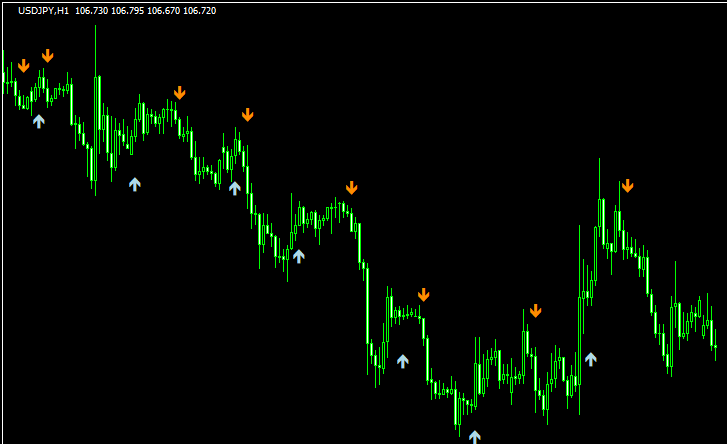
サインのみ複数の指標を使ってサインを出す「win-win-arrows-alerts-labels」
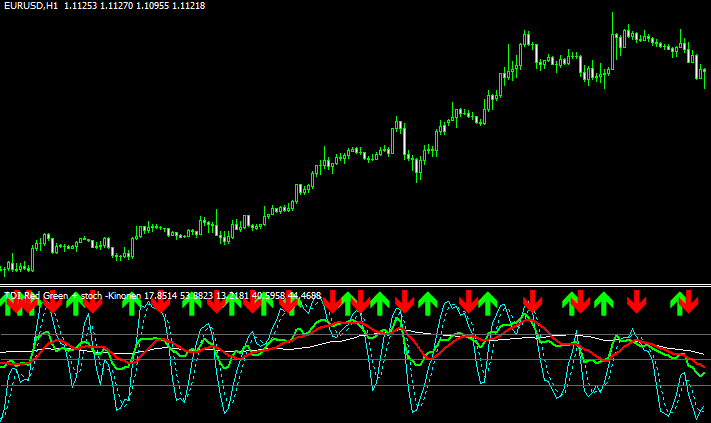 オシレーター
ラインのクロスでサインの出る「Tdi Red Green Indicator」
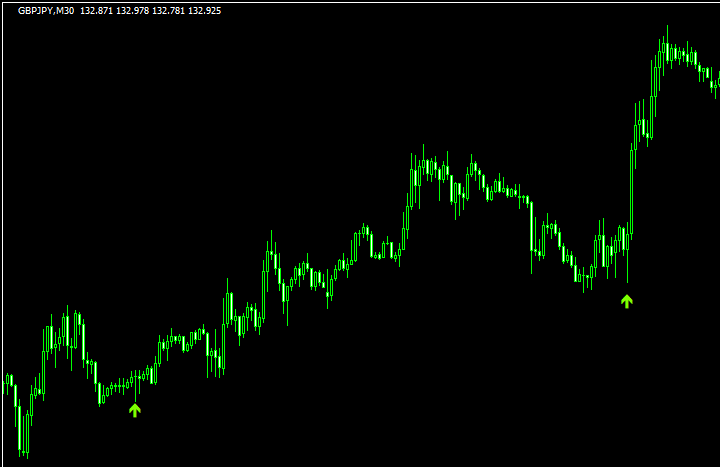
 サインのみ
サインのみマルチタイムに対応したASCTrend「TrendSignal 2.31 mtf」
 パターン認識
1本の足を2本の足で包んだらサインの出る「double_bars」
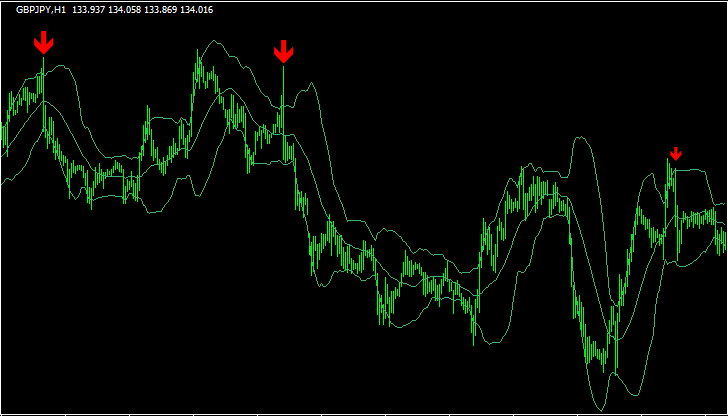
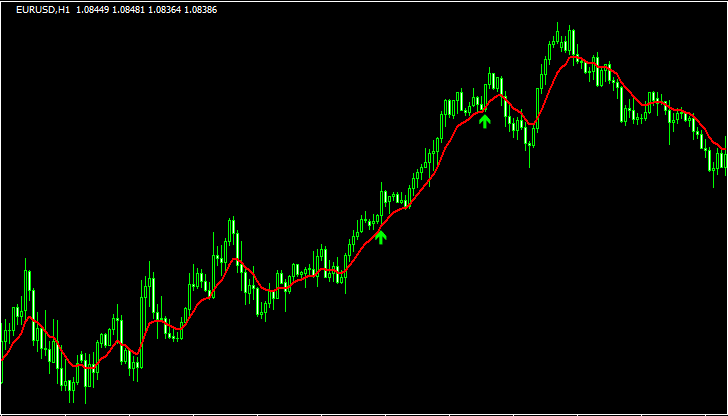
 バンドタイプ
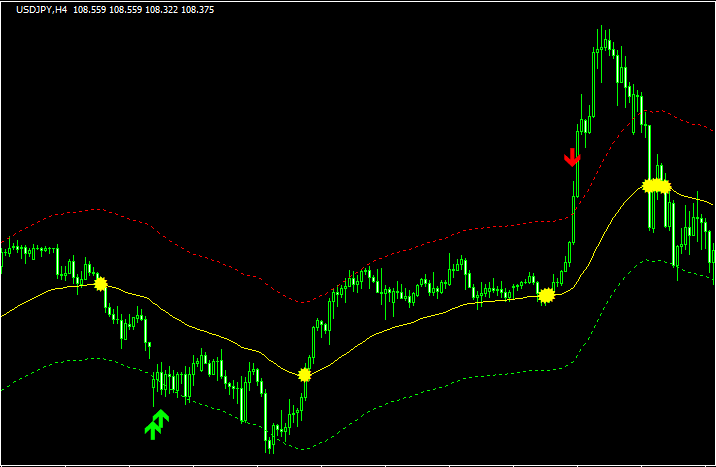
チャネルに当たるとサインの出る「Highly_Adaptable_MA_Alerts」
 サインのみ
サインのみ使いどころが難しいシグナルインジ「Expand Profit」
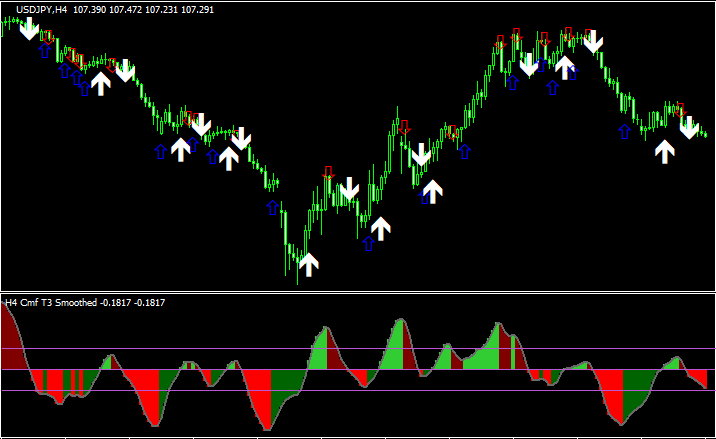 オシレーター
チャイキン・マネー・フローベースとした「Chalkin Money Flow Teamtrader」
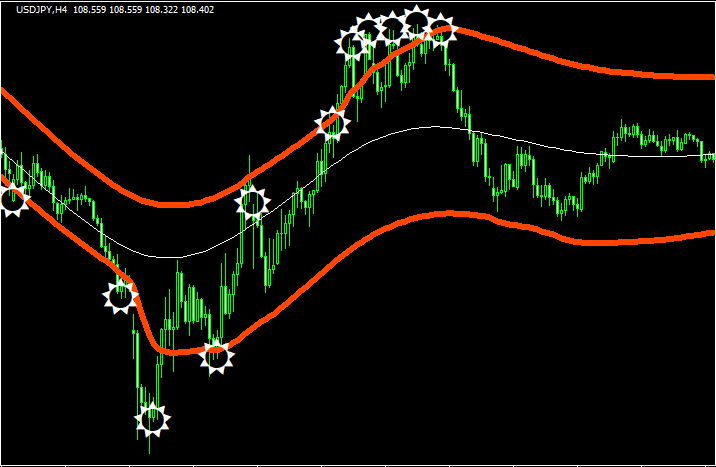 バンドタイプ
利食いの参考になる「TARGET BANDS」
 パターン認識
Three Methodsを認識する「FRThreeMethods」
 パターン認識
包み足とボリバンからの反転の組み合わせでサインが出る「OutsidebarsBB」
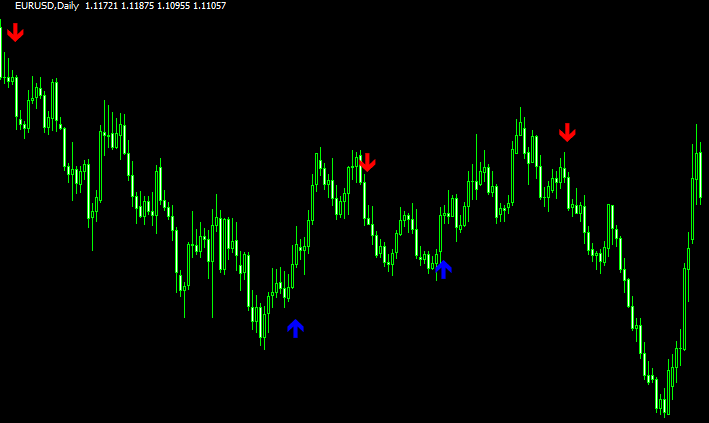
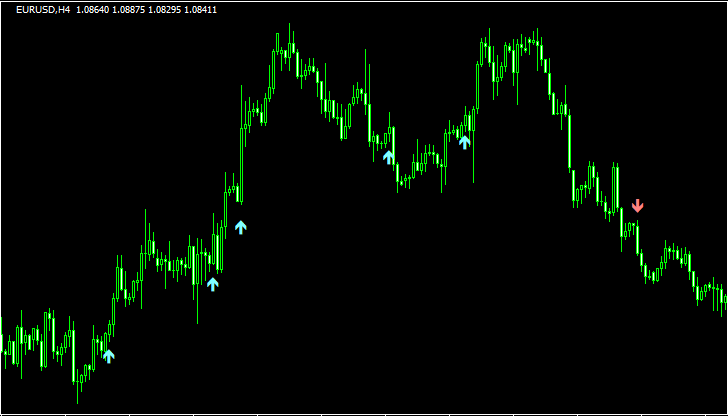
![ZZ NRP AA TT [x3]のチャート画像](https://technical-indicators.com/wp-content/uploads/2020/03/zznrp.png) ジグザグ系
ジグザグ系サインはリペイントしない「ZZ NRP AA TT [x3]」
 パターン認識
包み足とグランビルの組み合わせでサインが出る「Outsidebars_MA」
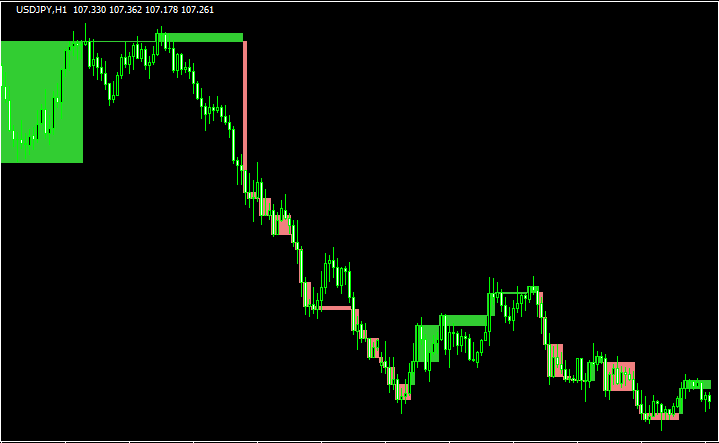 ボックス
ボックスレンジからのブレイクが狙える「UniLineBreak_v2.5」
 パターン認識
マスターキャンドルの逆でサインが出る「Reverse_Master」
勝てる手法10個+超凄いインジをプレゼント!

\初心者から上級者まで大注目!/
当サイト限定で、XMの口座開設をすると「Forex Standard Club XM版」へ無料招待!
✔️ 期間限定で13,000円のボーナス!
✔️ 最大500ドルまで100%入金ボーナス!
✔️ 勝率を上げるトレード手法&限定インジケーターを多数提供!
将来の動きを予測する無料ツール差し上げます

未来予測インジケーター「Futuro FX」は、過去の動きと現在の動きの相関から少し先の動きを予測します。メルマガ登録で詳しい解説書をプレゼント!
さらにスマートマネーコンセプト(SMC)について解説したPDFもプレゼント!
\初心者から上級者まで大注目!/
当サイト限定で、XMの口座開設をすると「Forex Standard Club XM版」へ無料招待!
✔️ 13,000円のボーナス!
✔️ 最大1000ドルまで100%入金ボーナス!
✔️ 勝率を上げるトレード手法&限定インジケーターを多数提供!