
 バータイプ
バータイプバータイプ
バータイプ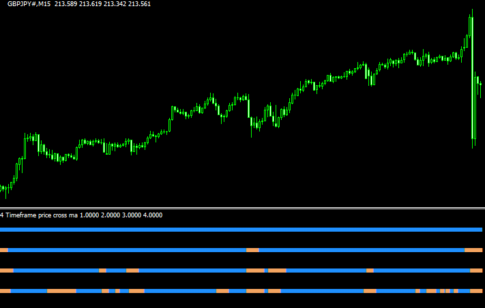 バータイプ
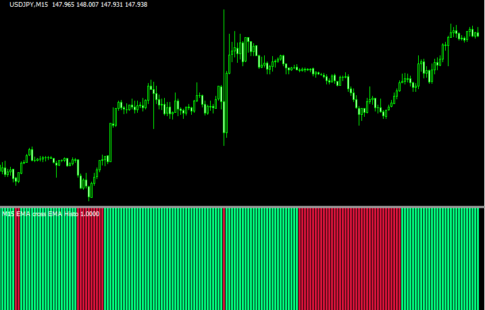
バータイプ4つの時間足で価格とMAの位置関係を色で示す「4 time frame price cross ma (alerts)」
 バータイプ
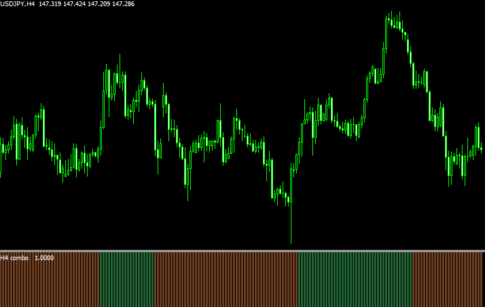
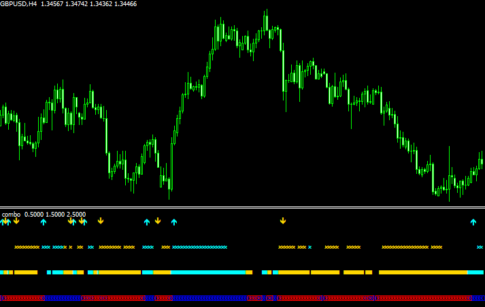
バータイプ複数の指標を統合してトレンド方向を示す「combo (x8)」
 バータイプ
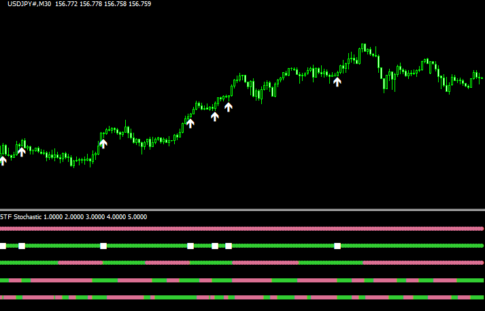
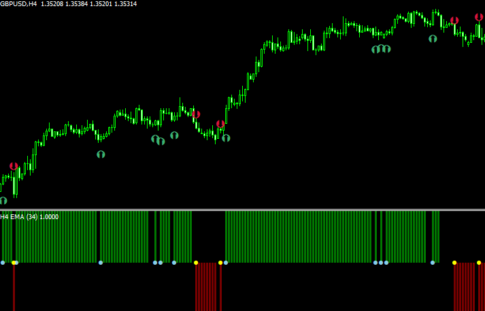
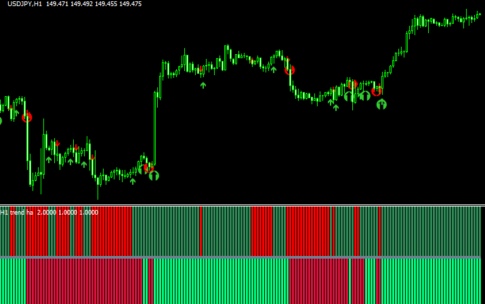
バータイプ4つの移動平均線の状況をバーの色で示す「4 ma cross histo (mtf + alerts + arrows)」
 バータイプ
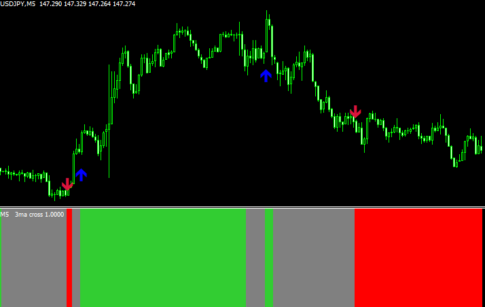
バータイプ複数の指標が揃ったらサインが出る「combo x」
 バータイプ
バータイプMAチャネルとの関係性を示してサインも出す「price cross(ud+dn+shift+arrows) eAverages 」
 バータイプ
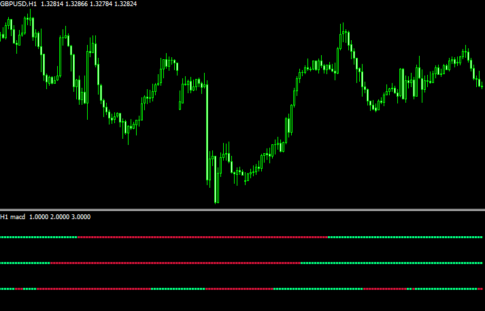
バータイプ3つのパラメーターのMACDの状況を示す「macd (3x)」
 バータイプ
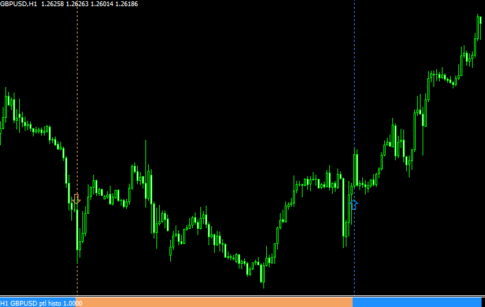
バータイプptlの示すトレンドをバーの色で示す「ptl 2.09 histo (alerts + lines + arrows + multisymbol)」
 バータイプ
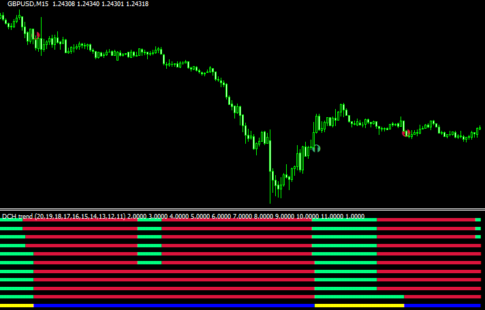
バータイプ複数のパラメーターでドンチャンチャネルの方向を示す「donchian trend(+ ribbon)」
 バータイプ
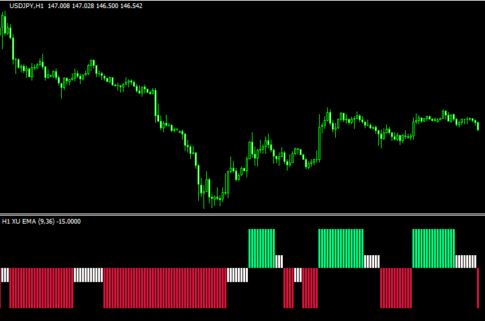
バータイプ2本のMAの状況をバーで示す「xu ma (histo + mtf) 1.1」
 バータイプ
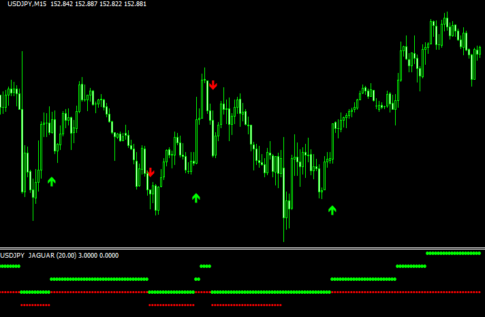
バータイプトレンド方向や過熱具合を示す「jaguar 2」
 バータイプ
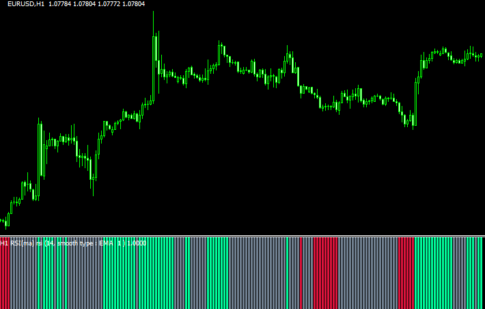
バータイプRSIが条件を満たしたらバーの色が変わりサインも出る「rsi (histogram)」
 バータイプ
バータイプ移動平均線のクロスで色が変わるバー「avgs cross histo (mtf + alerts + arrows)」
 バータイプ
バータイプ2つの期間の平均足MAの方向を示す「trend heiken ashi(+ histo) 1.1」
 バータイプ
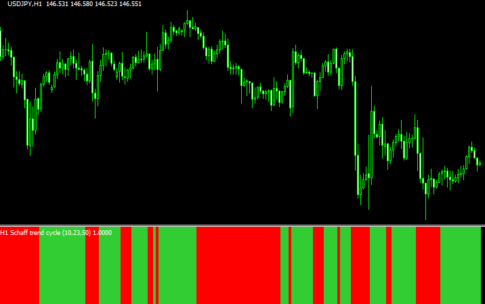
バータイプSchaffの向きによって色の変わる「!!! Schaff Trend Cycle nrp histo (mtf + arrows + alerts)」
 バータイプ
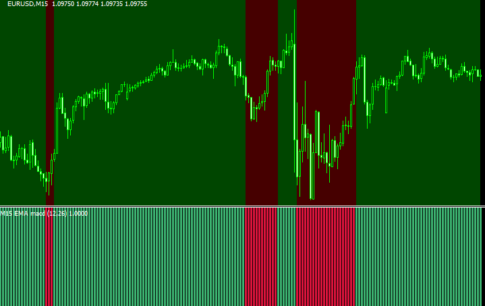
バータイプMACDの状況をバーと背景の色で示す「Macd (zones)」
勝てる手法10個+超凄いインジをプレゼント!

\初心者から上級者まで大注目!/
当サイト限定で、XMの口座開設をすると「Forex Standard Club XM版」へ無料招待!
✔️ 期間限定で13,000円のボーナス!
✔️ 最大500ドルまで100%入金ボーナス!
✔️ 勝率を上げるトレード手法&限定インジケーターを多数提供!
将来の動きを予測する無料ツール差し上げます

未来予測インジケーター「Futuro FX」は、過去の動きと現在の動きの相関から少し先の動きを予測します。メルマガ登録で詳しい解説書をプレゼント!
さらにスマートマネーコンセプト(SMC)について解説したPDFもプレゼント!
\初心者から上級者まで大注目!/
当サイト限定で、XMの口座開設をすると「Forex Standard Club XM版」へ無料招待!
✔️ 13,000円のボーナス!
✔️ 最大1000ドルまで100%入金ボーナス!
✔️ 勝率を上げるトレード手法&限定インジケーターを多数提供!