
 トレンド表示型
トレンド表示型
トレンド表示型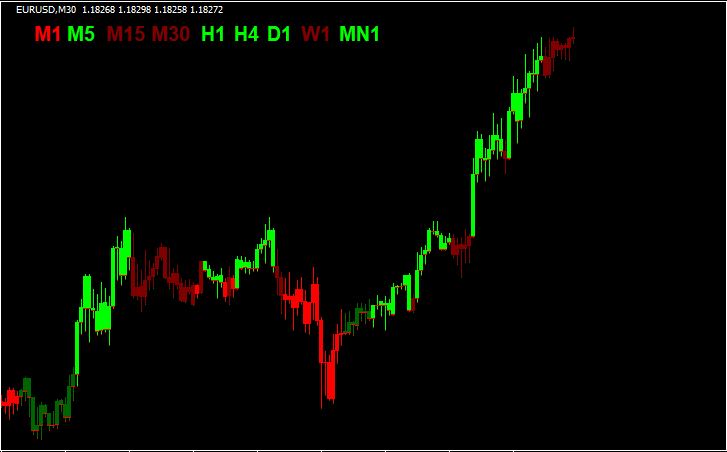 トレンド表示型
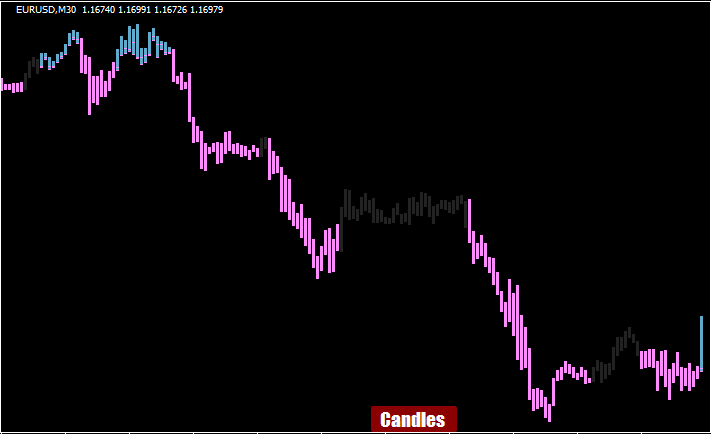
MACDの状況をローソク足に反映させる「macd-trend-candles」
 トレンド表示型
一目均衡表の雲との位置関係でローソク足の色が変わる「ZB-CloudCandles」
 トレンド表示型
EMAより上にあるか下にあるかでローソク足の色が変わる「ema chart bars」
 トレンド表示型
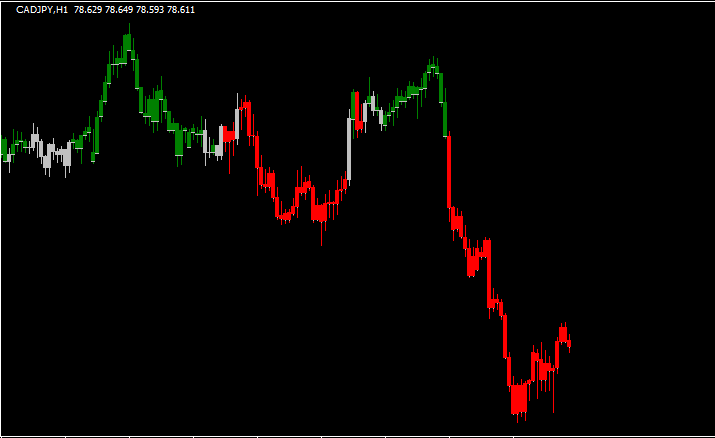
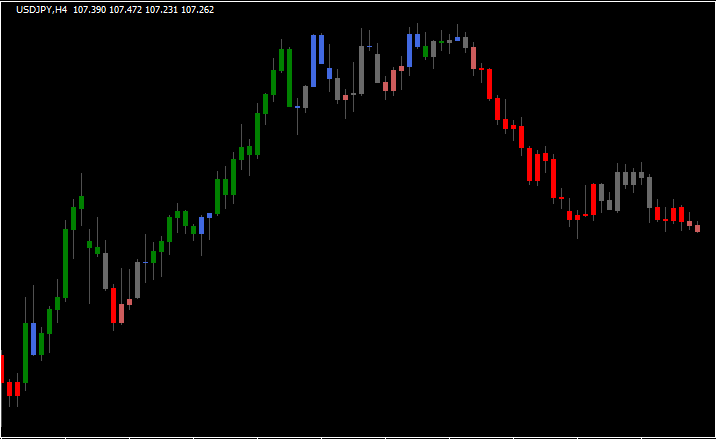
転換線と基準線のクロス具合でローソク足の色が変わる「tenkan_sen-kijun_sen_candles_nmc & histo」
 トレンド表示型
RSIが上限や下限に来るとローソク足の色が変わる「RSICandles」
 トレンド表示型
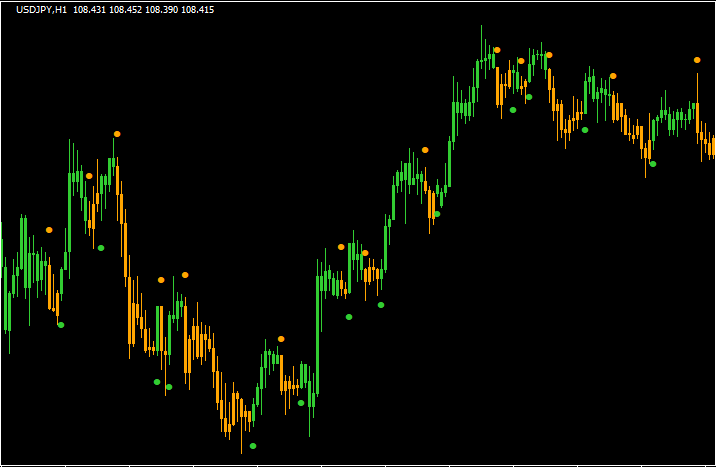
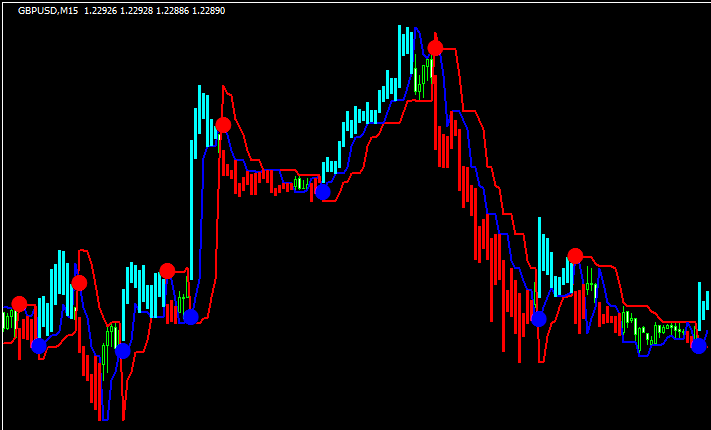
4つのインジケーターからトレンドの強さをローソク足の色に反映させる「ay-TrendFinder-Candles」
 トレンド表示型
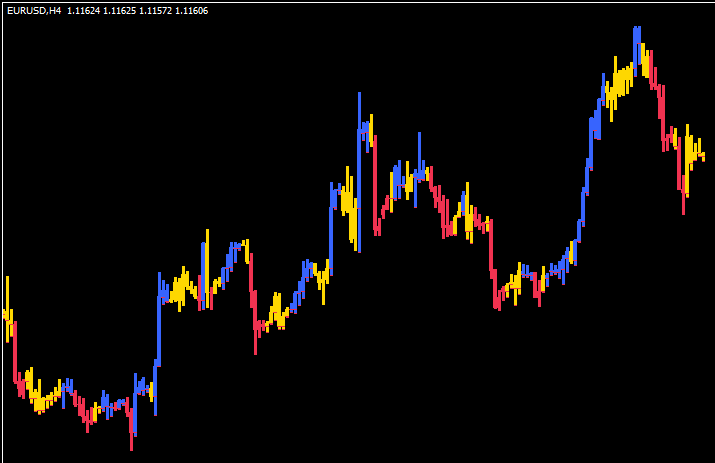
相場の勢いが視覚的にわかりやすい「dwebPriceTrend」
 トレンド表示型
ASCTrendのトレンド方向によってローソク足の色が変わる「labtrend_v_4.03」
 トレンド表示型
MACDの状況で色がローソク足の色が変わる「(M) Momentum Bars」
 トレンド表示型
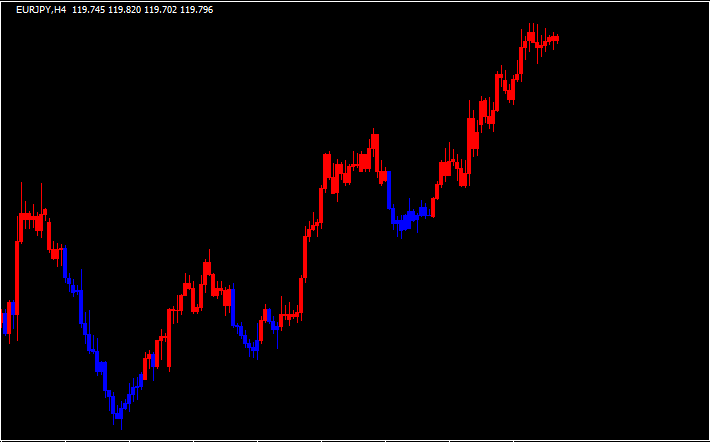
基準線を基準にローソク足の色が変わる「kijun sen candles alerts」
 トレンド表示型
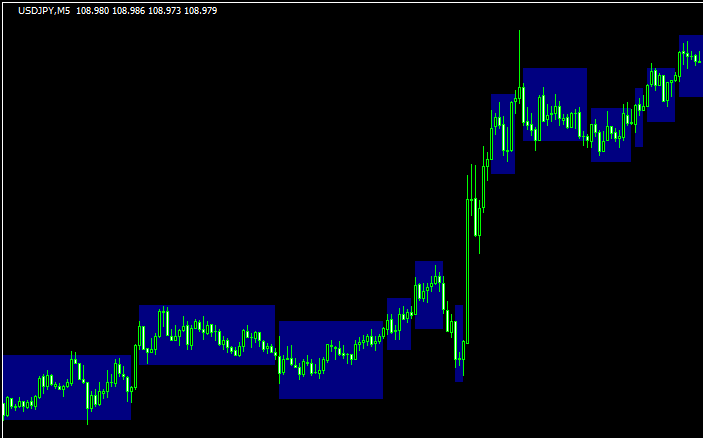
トレンドが視覚化される「easytrendvisualizer」
 トレンド表示型
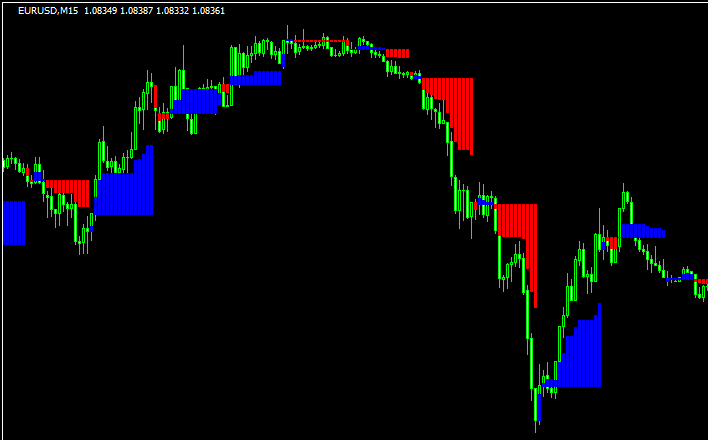
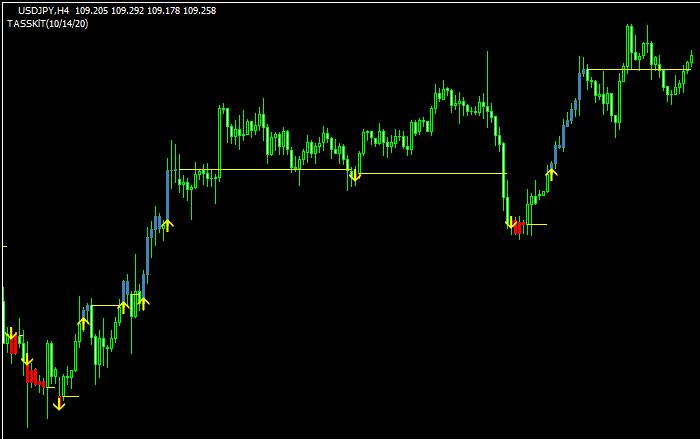
横ばいの値動きを判定するSidewaysDetector
 トレンド表示型
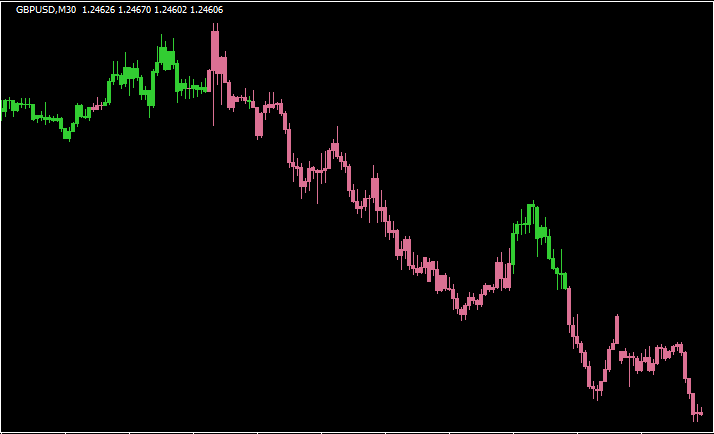
トレンド方向によってローソク足の色が変わる「PerfecTrend_Lines」
 トレンド表示型
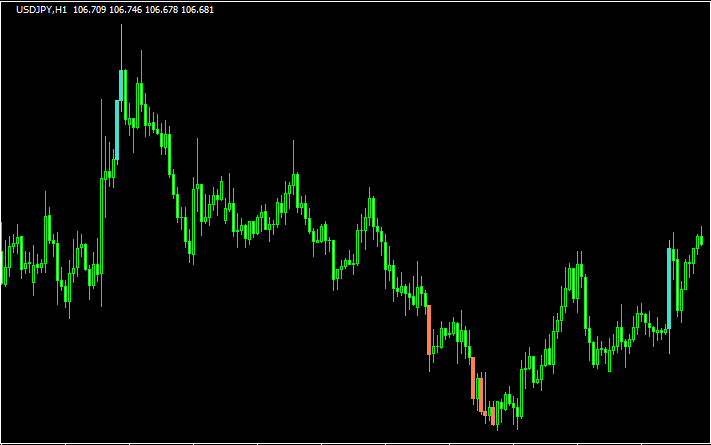
相場の向きによってローソク足の色が変わる「candlesticks-bw-indicator」
 トレンド表示型
RSIの「売られすぎ・買われすぎ」をローソク足に示す「RSI Candle OverBought-Sold」
勝てる手法10個+超凄いインジをプレゼント!

\初心者から上級者まで大注目!/
当サイト限定で、XMの口座開設をすると「Forex Standard Club XM版」へ無料招待!
✔️ 期間限定で13,000円のボーナス!
✔️ 最大500ドルまで100%入金ボーナス!
✔️ 勝率を上げるトレード手法&限定インジケーターを多数提供!
将来の動きを予測する無料ツール差し上げます

未来予測インジケーター「Futuro FX」は、過去の動きと現在の動きの相関から少し先の動きを予測します。メルマガ登録で詳しい解説書をプレゼント!
さらにウォルフ波動を使ったトレード手法解説と本当に使えるウォルフ波動を認識するインジケーターもメルマガ内でご紹介します!
\初心者から上級者まで大注目!/
当サイト限定で、XMの口座開設をすると「Forex Standard Club XM版」へ無料招待!
✔️ 13,000円のボーナス!
✔️ 最大1000ドルまで100%入金ボーナス!
✔️ 勝率を上げるトレード手法&限定インジケーターを多数提供!