
 オシレーター
サブチャート
オシレーター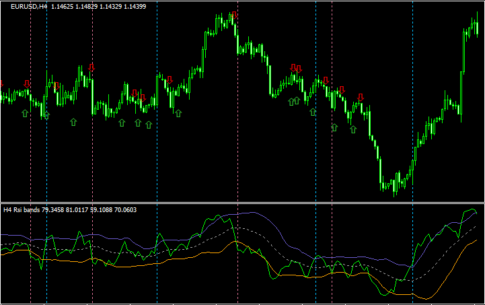 オシレーター
RSIにボリバンを表示し、サインも出る「RSI + Bollinger bands 1.01 & lines + alerts + arrows mtf」
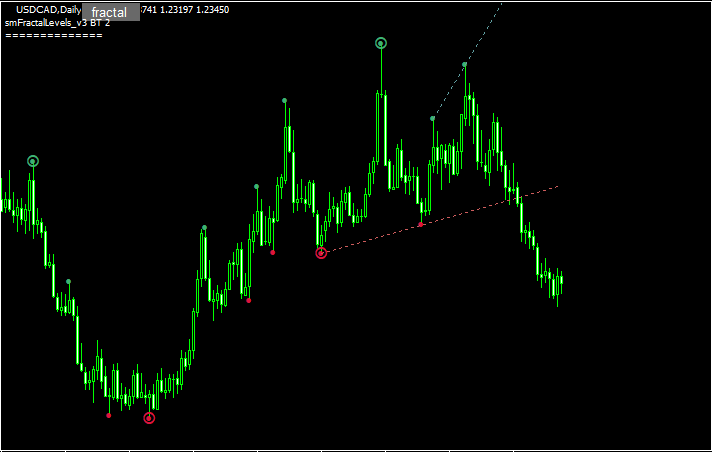 ラインタイプ
フラクタルを利用してトレンドラインを表示する「smFractalLevels_v3 BT 2」
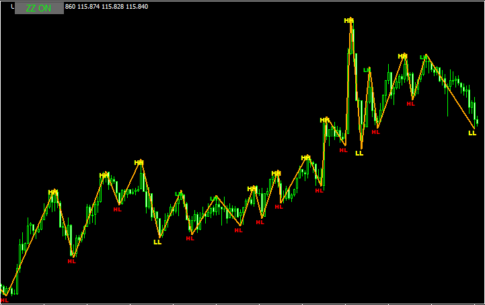 ジグザグ系
ジグザグ系ZigZagをベースに高値や安値が分かりやすくなる「ZigZag_HH-HL-LH-LL_B BT」
 オシレーター
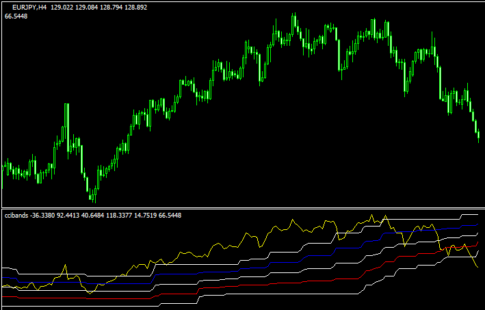
CCIにバンドを表示す「ccibands」
 オシレーター
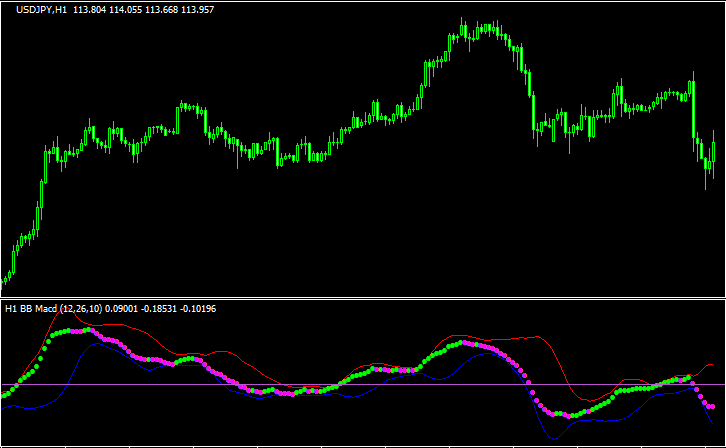
MACDにボリバンを追加した「bbmacd_nrp_mtfalerts_nmc」
 オシレーター
相場が勢いづいたところでサインが出る「Kurtosis alerts + arrows」
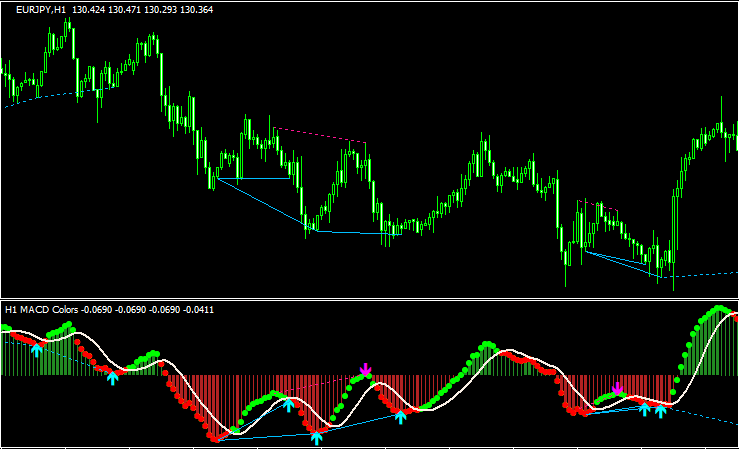
 オシレーター
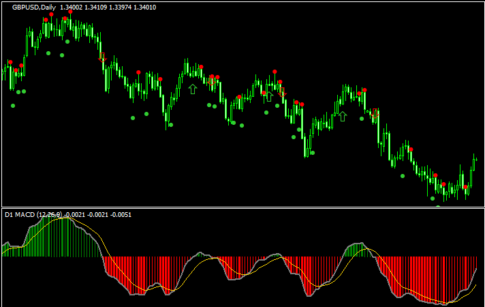
流れが切り替わったところでサインの出るMACD「macd all colored (mtf + arrows + alerts)」
 オシレーター
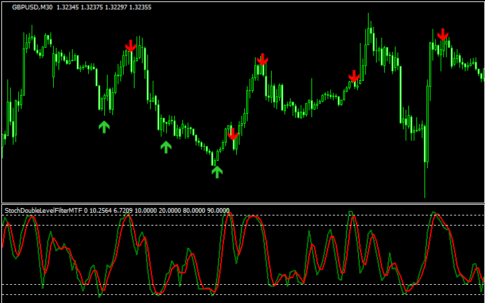
2つのストキャスの値からサインを出せる「StochDoubleLevelFilterMTF」
 オシレーター
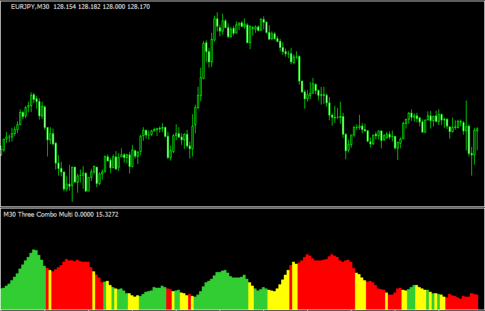
トレンド方向と勢いが分かりやすくなる「Three Combo MTF」
 オシレーター
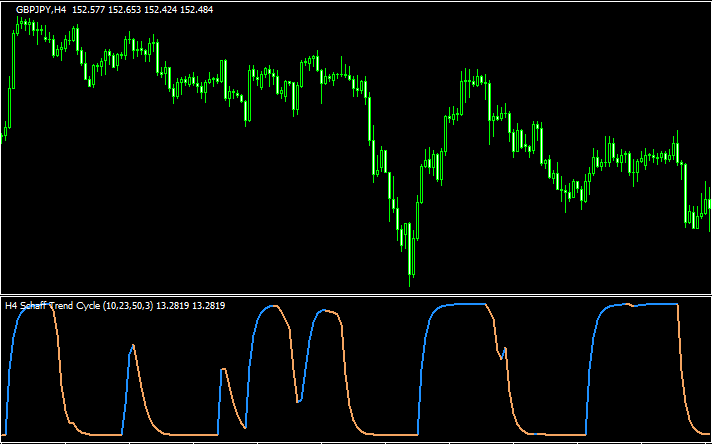
スムーズド化したシャフを表示する「Schaff_Trend_Cycle_-_adjustable_smoothing」
 バータイプ
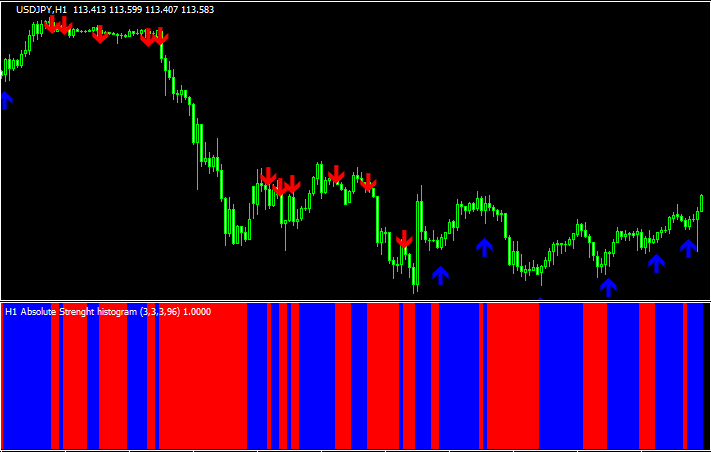
バータイプトレンドフィルターの備わったサインが出る「Absolute Strenght arrows」
 オシレーター
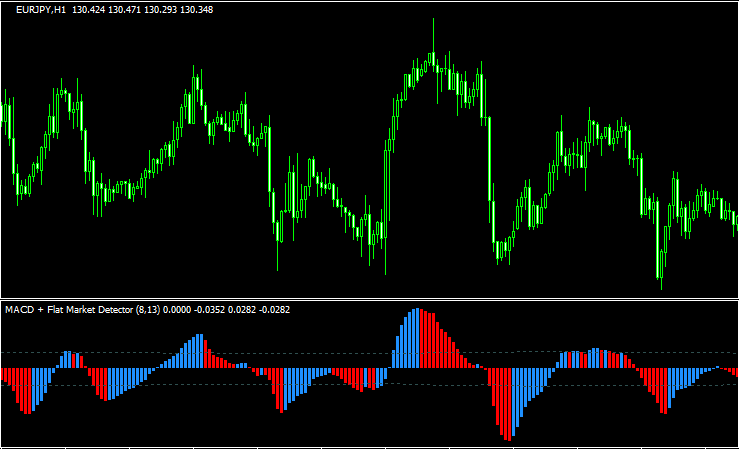
macdを表示「MACD FlatMarketDetector」
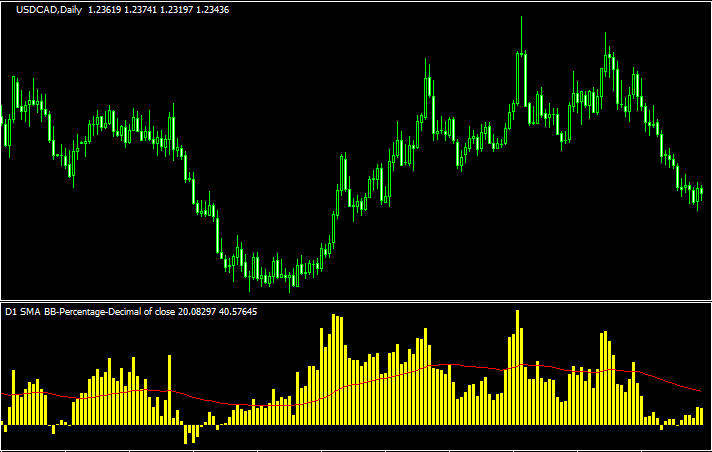 オシレーター
ボリバン%Bを改良した「Bollinger B% Options + Signal MTF hst」
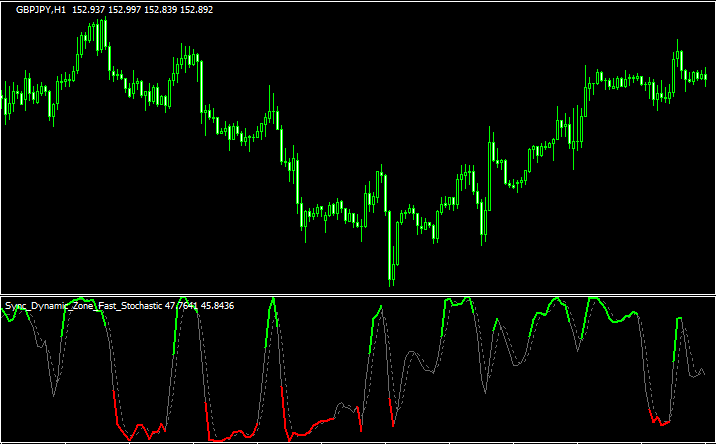 オシレーター
ストキャスの買われすぎ・売られすぎがわかりやすい「Sync_Dynamic_Zone_Fast_Stochastic」
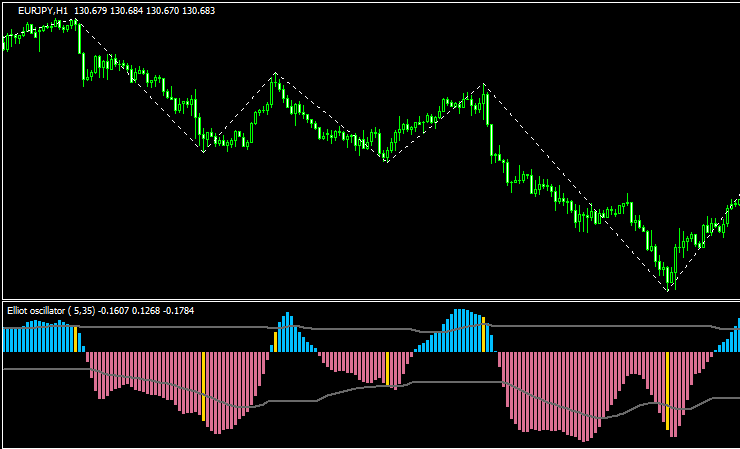 オシレーター
ジグザグのような波も表示される「Elliot oscillator – waves 1.02」
勝てる手法10個+超凄いインジをプレゼント!

\初心者から上級者まで大注目!/
当サイト限定で、XMの口座開設をすると「Forex Standard Club XM版」へ無料招待!
✔️ 期間限定で13,000円のボーナス!
✔️ 最大500ドルまで100%入金ボーナス!
✔️ 勝率を上げるトレード手法&限定インジケーターを多数提供!
将来の動きを予測する無料ツール差し上げます

未来予測インジケーター「Futuro FX」は、過去の動きと現在の動きの相関から少し先の動きを予測します。メルマガ登録で詳しい解説書をプレゼント!
さらにスマートマネーコンセプト(SMC)について解説したPDFもプレゼント!
\初心者から上級者まで大注目!/
当サイト限定で、XMの口座開設をすると「Forex Standard Club XM版」へ無料招待!
✔️ 13,000円のボーナス!
✔️ 最大1000ドルまで100%入金ボーナス!
✔️ 勝率を上げるトレード手法&限定インジケーターを多数提供!