


 ラインタイプラインタイプ
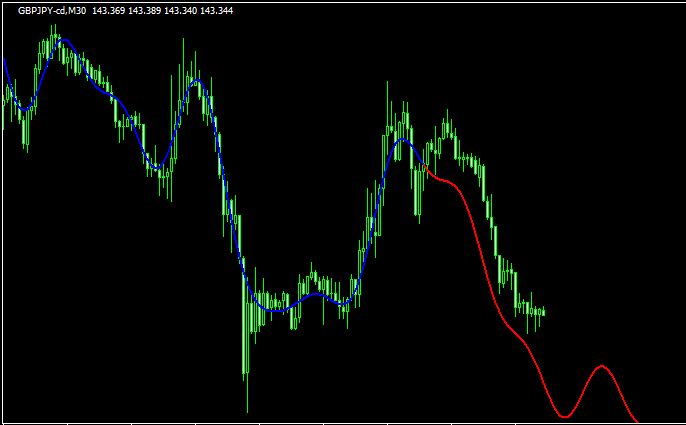 相場予測
相場予測先の動きを推測する「Extrapolator」
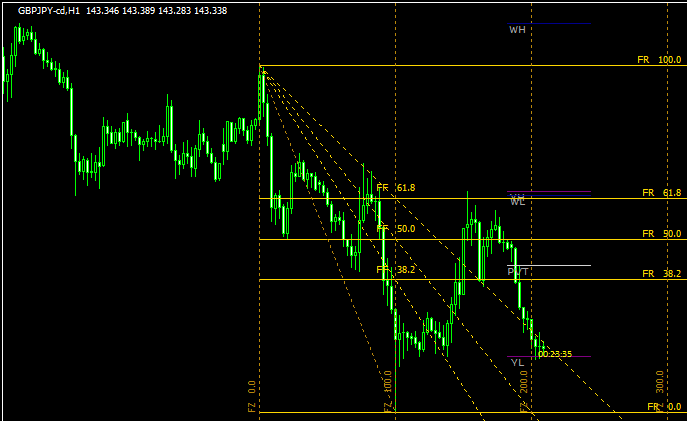 ラインタイプ
フィボナッチの世界にどっぷりと浸れる「ifibonacci」
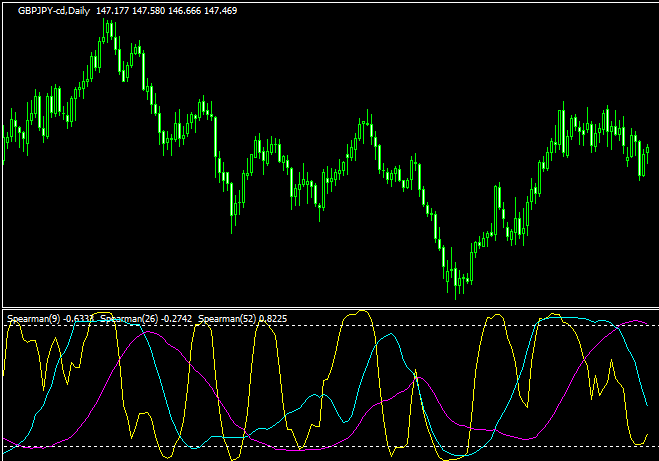
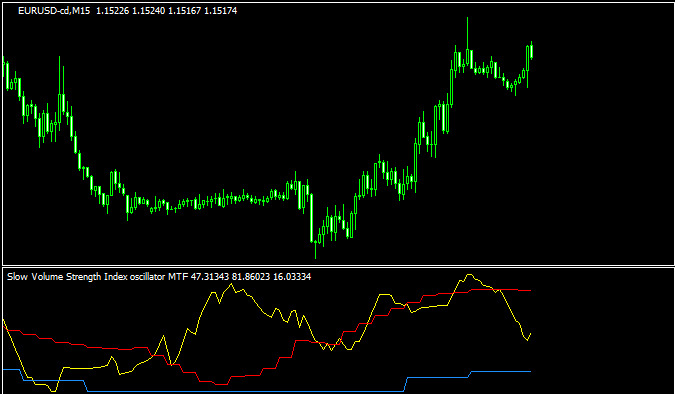 オシレーター
3つの時間軸で表示されるオシレーター「SVSI_MTF」
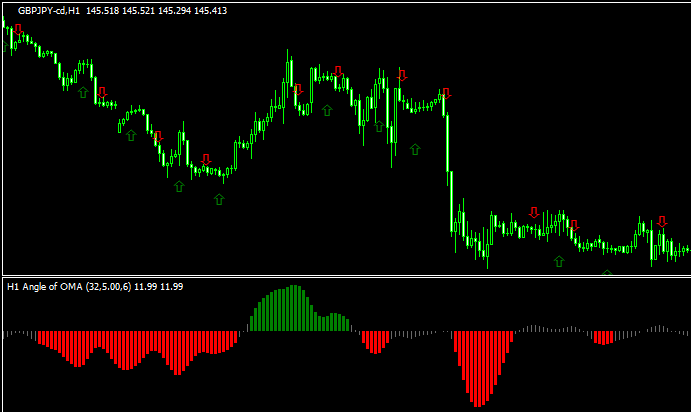 オシレーター
ヒストグラムの上下でサインが点灯する「angle of oma alerts arrows mtf」
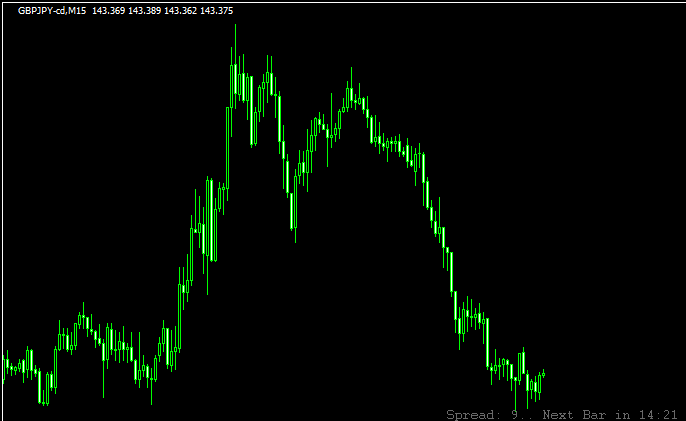 便利ツール
便利ツールローソク足が確定するまでの時間とスプレッドが表示される「Candle_Time_End_And_Spread」
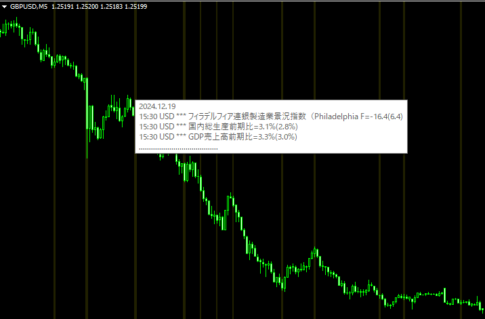
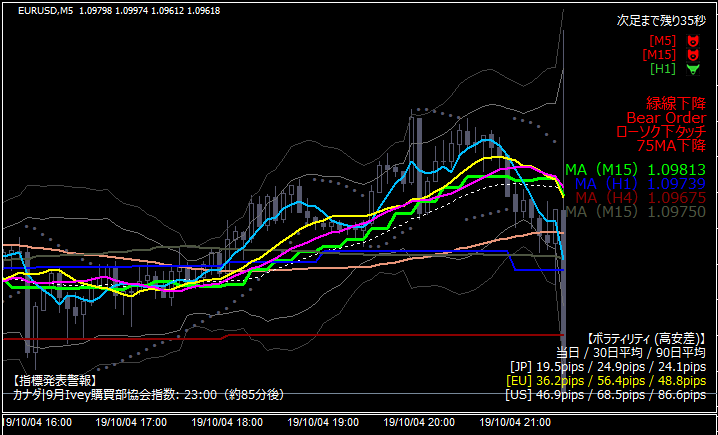
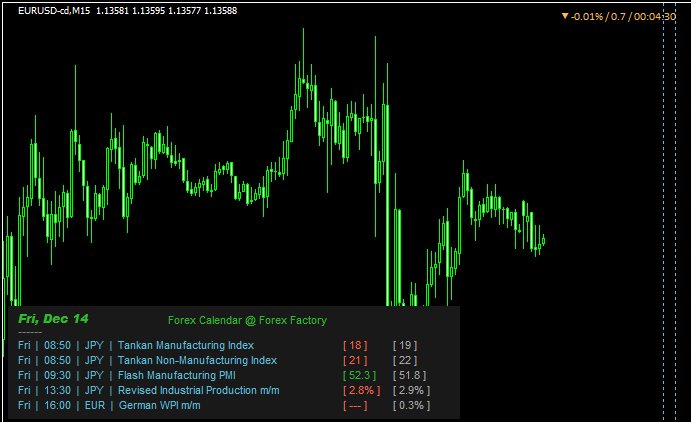 指標表示
指標表示その日の指標がチャート下に表示される「FFC」
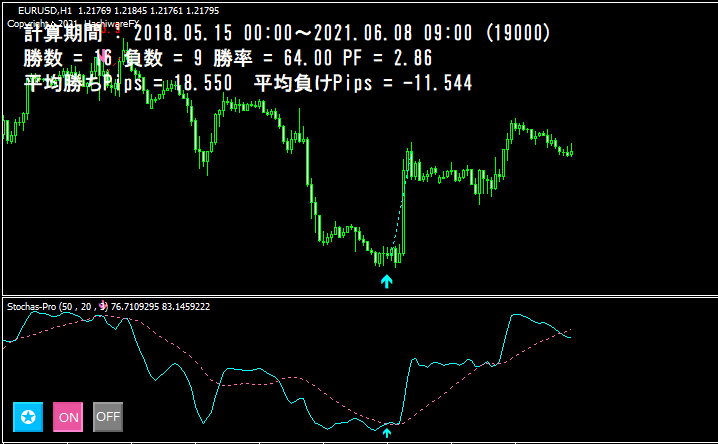
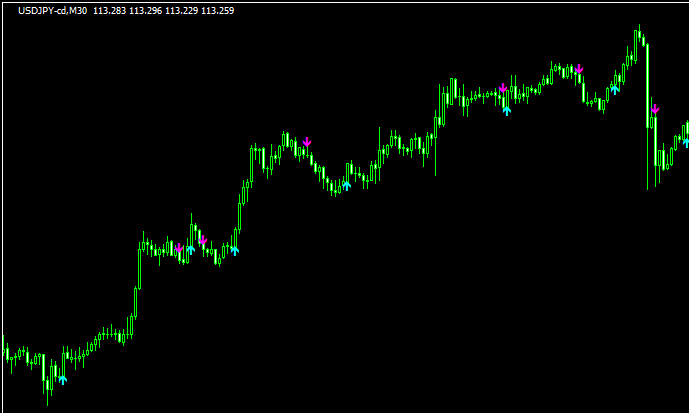 サインのみ
サインのみちょっとした反転ポイントでサインを出す「BykovTrend_Sig」
 オシレーター
MACDをベースとした「Macd averages tape 1.1」
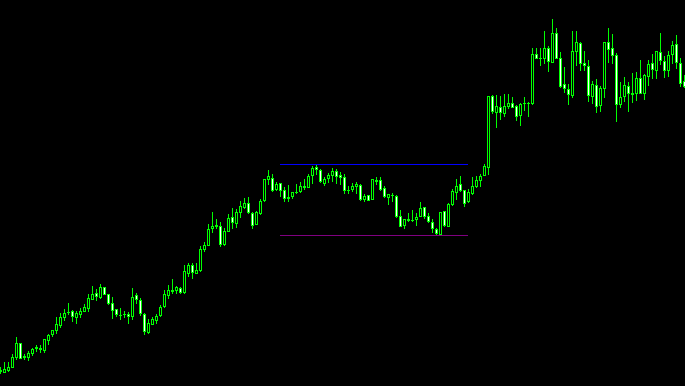 ラインタイプ
レンジからのブレイクを狙える「SDX-ZoneBreakout-Lud-Z2-v2」
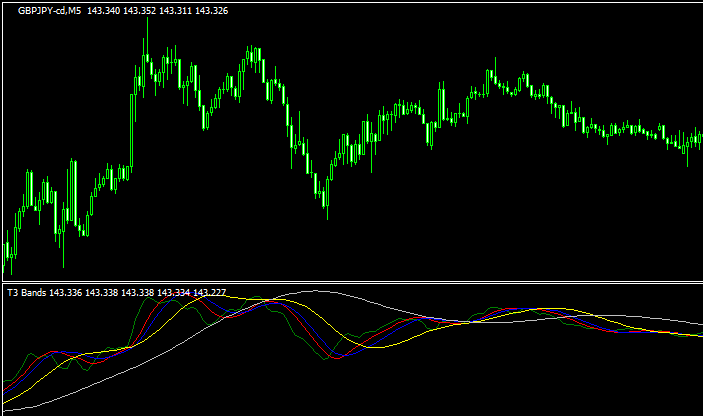 オシレーター
チャート下に複数のT3MAが表示される「T3_Bands2」
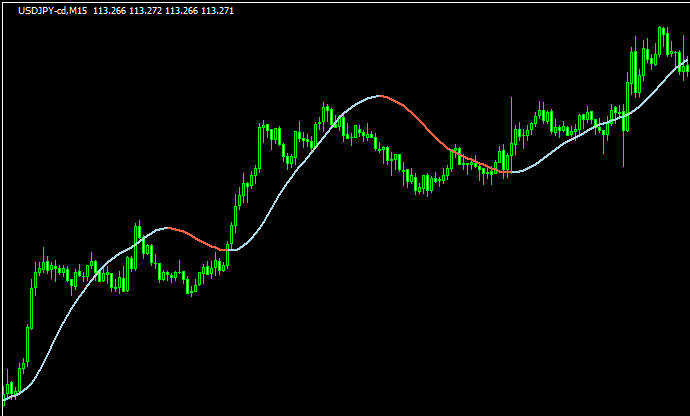 移動平均線タイプ
ダイナミックに相場の波を示す「Slope_Direction_Line」
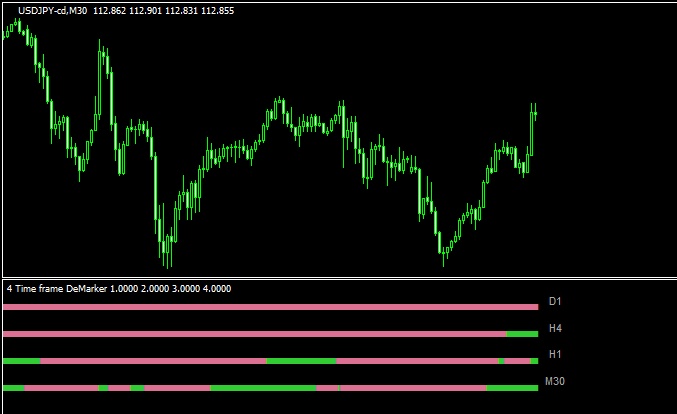 バータイプ
バータイプ4time frameのデマーカー版「4 time frame DeMarker nmc」
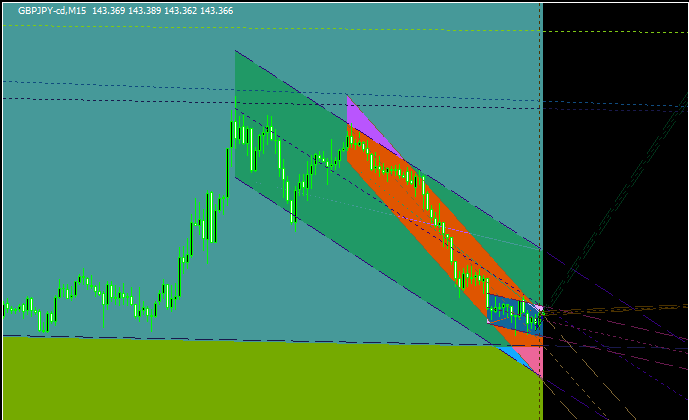 ラインタイプ
沢山のチャネルが表示される「Channels」
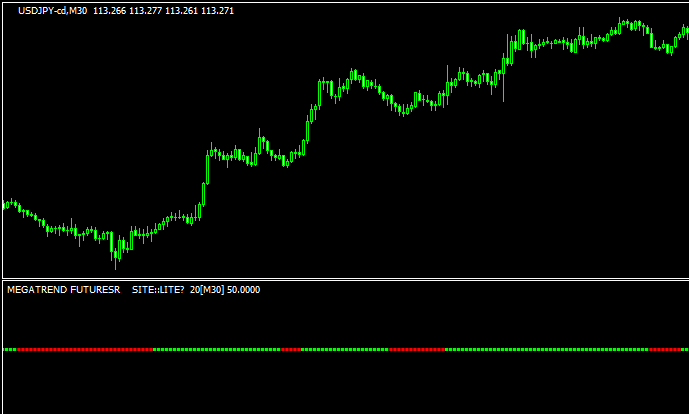 バータイプ
バータイプトレンド方向が分かりやすい「MEGATREND SITELITE」
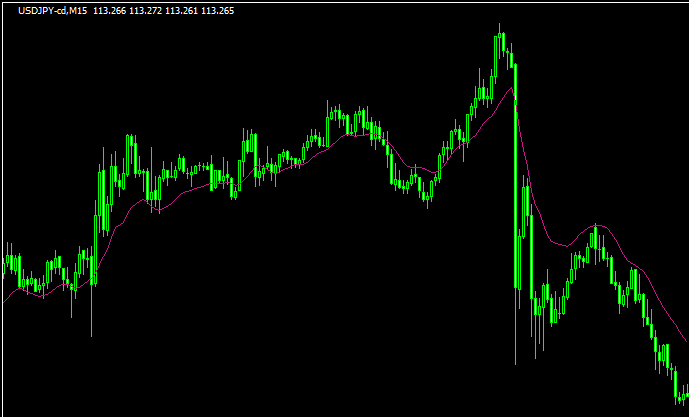 移動平均線タイプ
究極のMA?「ultimate-ma」
勝てる手法10個+超凄いインジをプレゼント!

\初心者から上級者まで大注目!/
当サイト限定で、XMの口座開設をすると「Forex Standard Club XM版」へ無料招待!
✔️ 期間限定で13,000円のボーナス!
✔️ 最大500ドルまで100%入金ボーナス!
✔️ 勝率を上げるトレード手法&限定インジケーターを多数提供!
将来の動きを予測する無料ツール差し上げます

未来予測インジケーター「Futuro FX」は、過去の動きと現在の動きの相関から少し先の動きを予測します。メルマガ登録で詳しい解説書をプレゼント!
さらにスマートマネーコンセプト(SMC)について解説したPDFもプレゼント!
\初心者から上級者まで大注目!/
当サイト限定で、XMの口座開設をすると「Forex Standard Club XM版」へ無料招待!
✔️ 13,000円のボーナス!
✔️ 最大1000ドルまで100%入金ボーナス!
✔️ 勝率を上げるトレード手法&限定インジケーターを多数提供!