


 移動平均線タイプ移動平均線タイプ
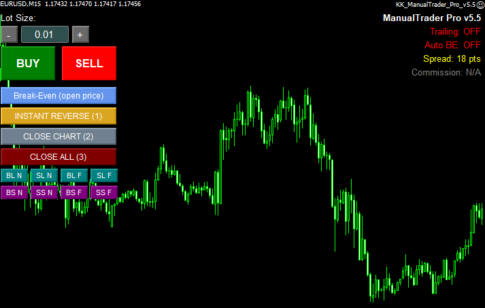 EA
EAドテン機能の付いた発注用EA「KK_ManualTrader_Pro_v5.5」
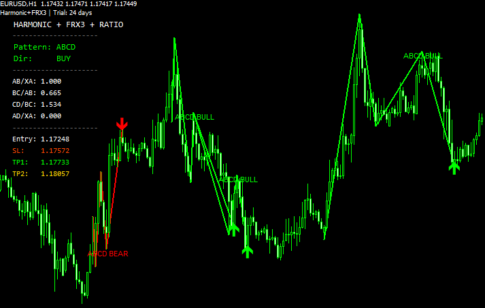 パターン認識
多くのハーモニックパターンを認識する「Harmonic_FRX_v3」
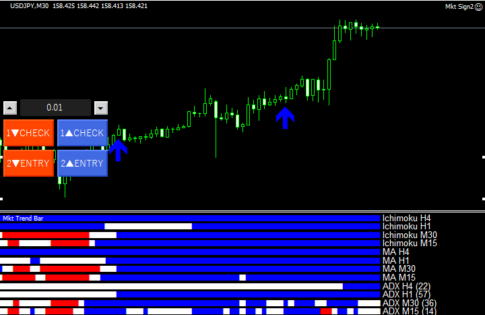
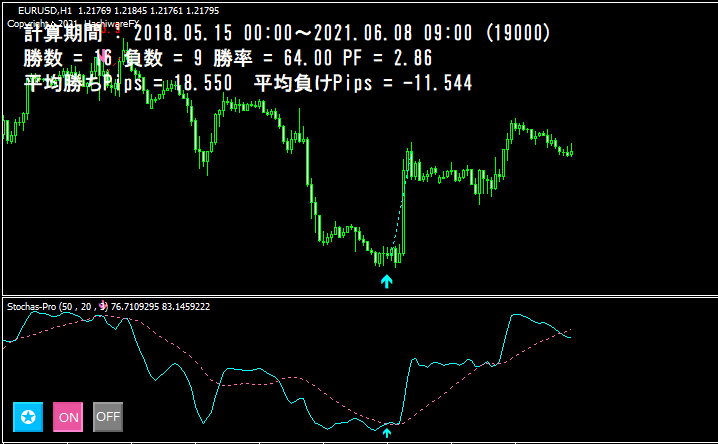
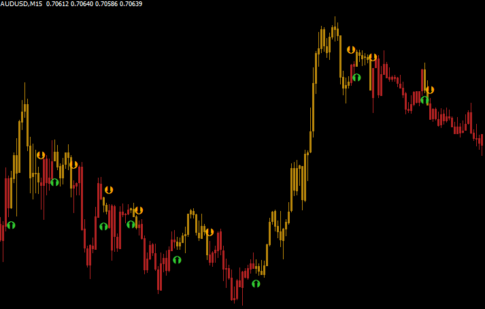
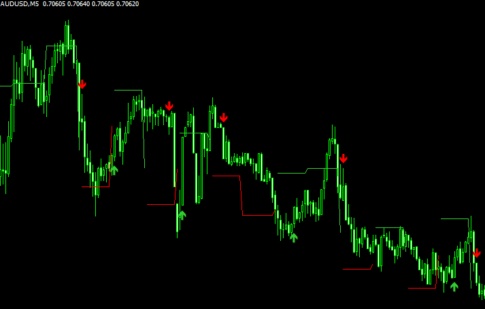 サインのみ
サインのみスキャル用のサインを出す「PBF Scalper」
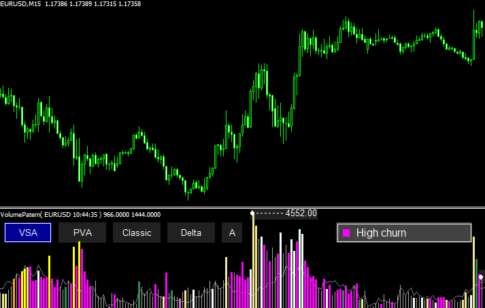 Volume
様々なスタイルでボリュームを表示する「Volume at Price (VAP)」
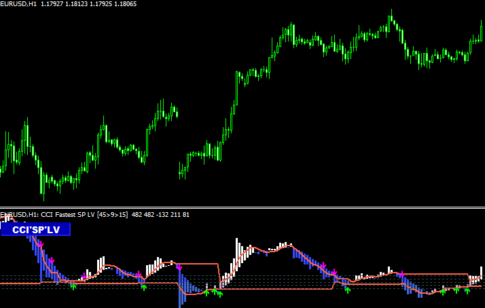 オシレーター
CCIを平均足スムーズドのように表示する「CCI Fastest simple levels」
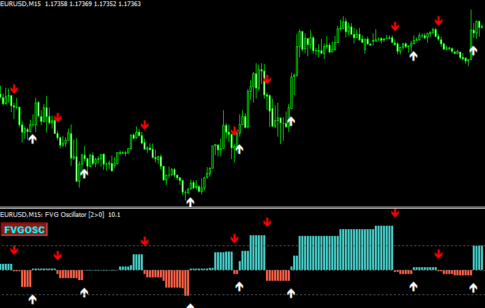 SMC
SMCFVGをオシレーター化してサインも出す「FVG Oscillator」
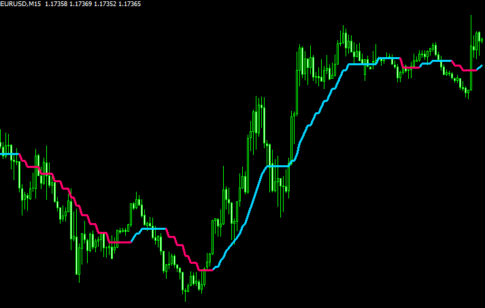 移動平均線タイプ
PDFMAをステップ化した「ATR_Stepped_PDFMA」
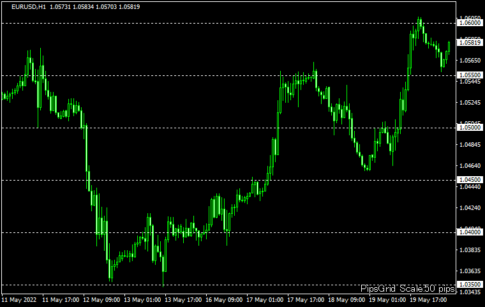
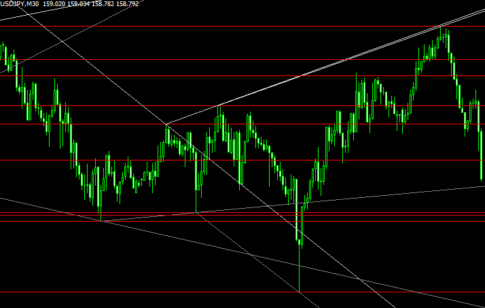 ラインタイプ
水平線とトレンドラインを描画する「mikko_autosr」
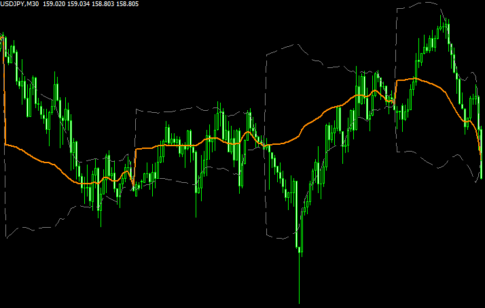 移動平均線タイプ
VWAPとバンドを表示する「Institutional_VWAP」
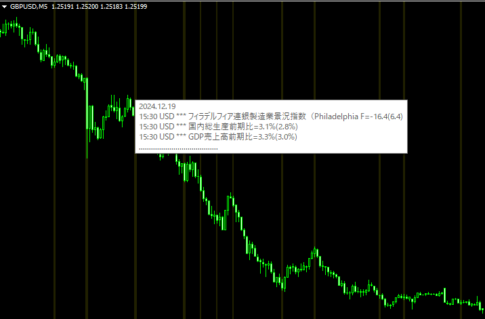
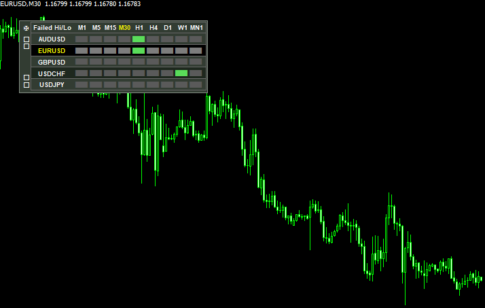 相場状況表示
ひとつ前の足の高値や安値を抜けて戻ってきたら教えてくれる「Failed HiLo Dashboard ( updated Alerts )」
 平均足
平均足多くの計算方法が選択できる平均足スムーズド「ha smoothed (ohlc candles)1.1」
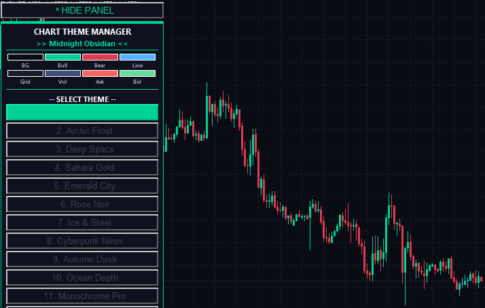 便利ツール
便利ツールボタンクリックでチャートのテーマを色々と変更できる「ChartThemeManager」
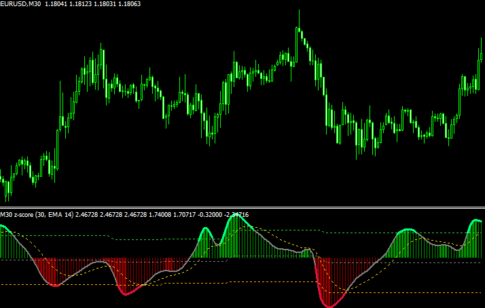 オシレーター
様々な計算方法に対応したZスコア「z-score ( + variation)1.1」
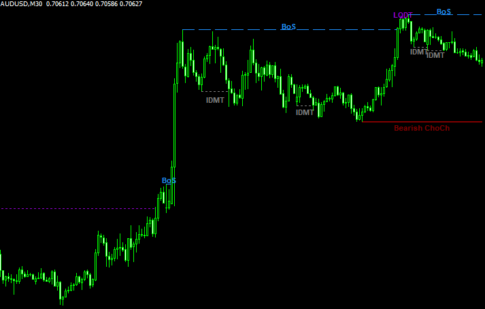 SMC
SMCマーケットストラクチャーをシンプルに表示「Market Structure1」
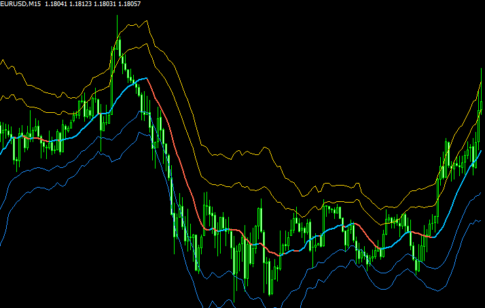 移動平均線タイプ
様々な計算方法でMAとATRバンドを表示する「AllAverages_v5.1」
勝てる手法10個+超凄いインジをプレゼント!

\初心者から上級者まで大注目!/
当サイト限定で、XMの口座開設をすると「Forex Standard Club XM版」へ無料招待!
✔️ 期間限定で13,000円のボーナス!
✔️ 最大500ドルまで100%入金ボーナス!
✔️ 勝率を上げるトレード手法&限定インジケーターを多数提供!
将来の動きを予測する無料ツール差し上げます

未来予測インジケーター「Futuro FX」は、過去の動きと現在の動きの相関から少し先の動きを予測します。メルマガ登録で詳しい解説書をプレゼント!
さらにスマートマネーコンセプト(SMC)について解説したPDFもプレゼント!
\初心者から上級者まで大注目!/
当サイト限定で、XMの口座開設をすると「Forex Standard Club XM版」へ無料招待!
✔️ 13,000円のボーナス!
✔️ 最大1000ドルまで100%入金ボーナス!
✔️ 勝率を上げるトレード手法&限定インジケーターを多数提供!