
 パターン認識
自作インジケーター
パターン認識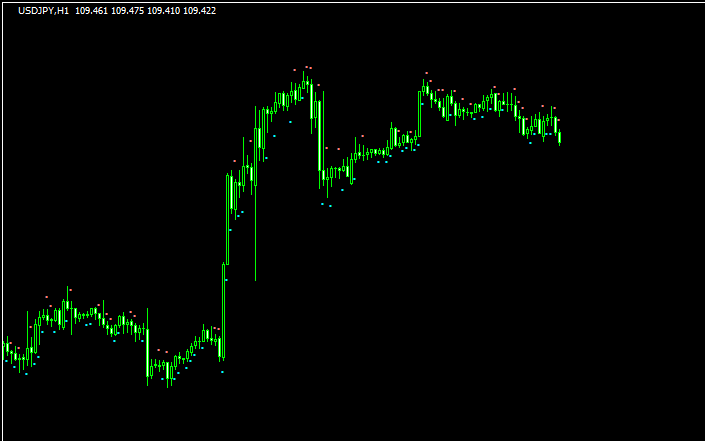 パターン認識
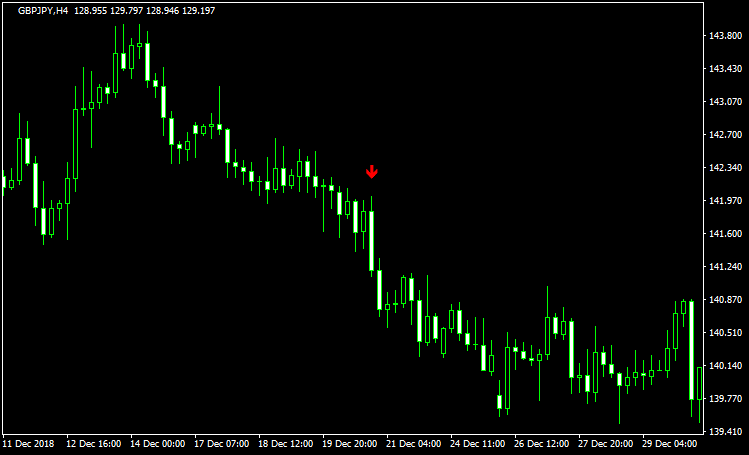
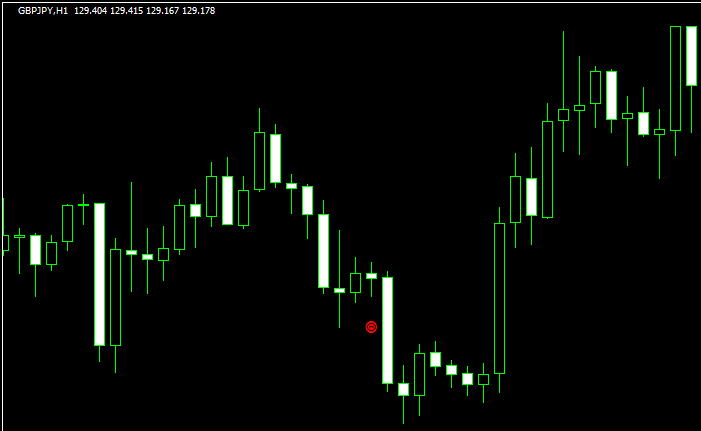
前の足の高値&安値切り上げor高値&安値切り下げでドットが出る「simplest_dot」
 オシレーター
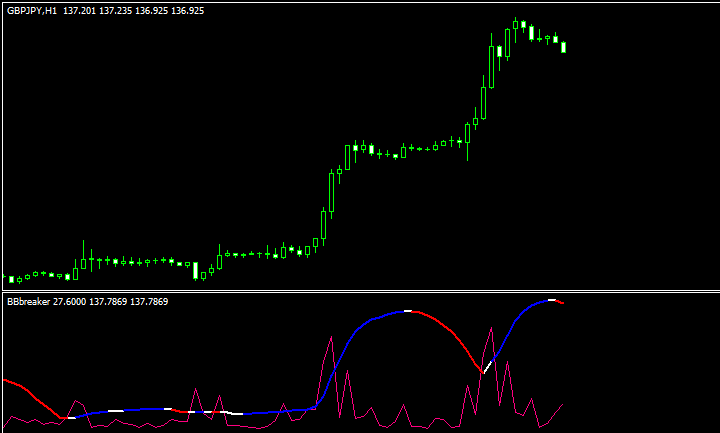
ボリバンのバンドブレイクを狙う「BBbreaker」
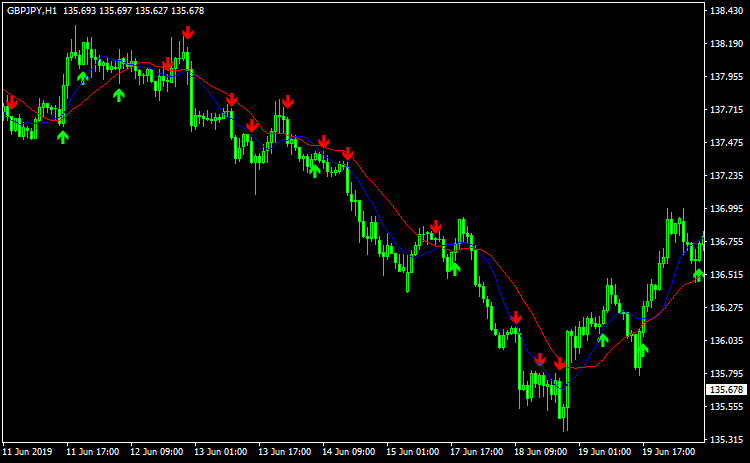
 移動平均線タイプ
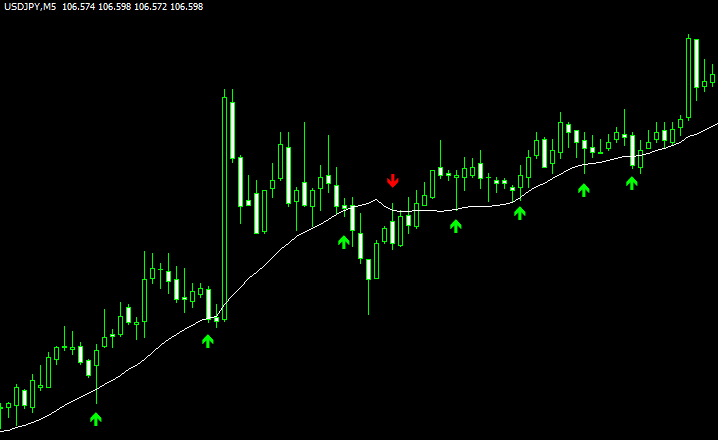
移動平均線にタッチしたらサインが出てアラートが鳴る「MAtouch」
 パターン認識
ポップガンを認識する「popgun」
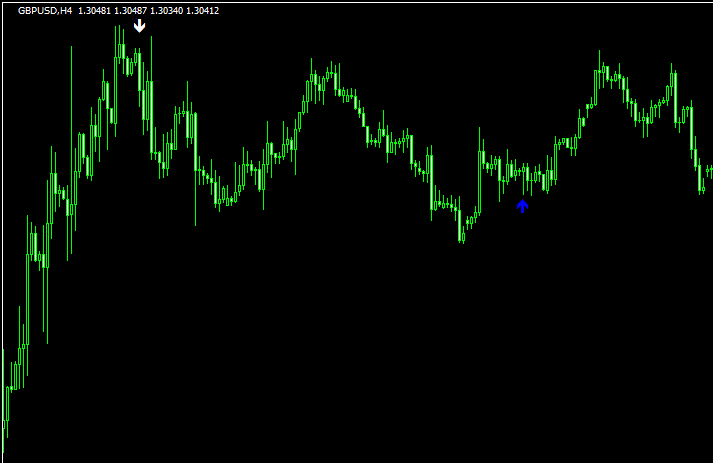
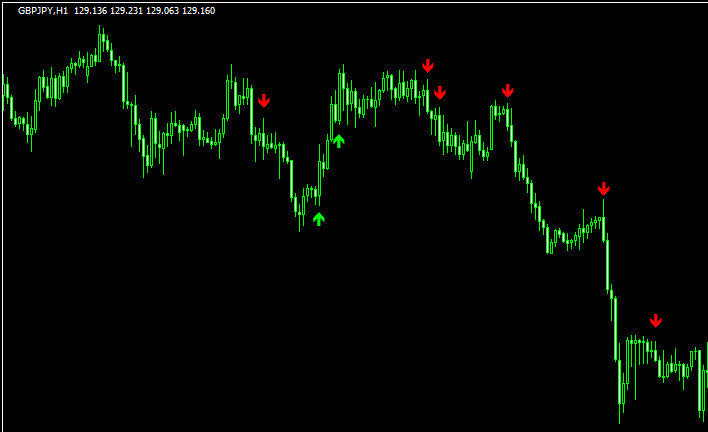
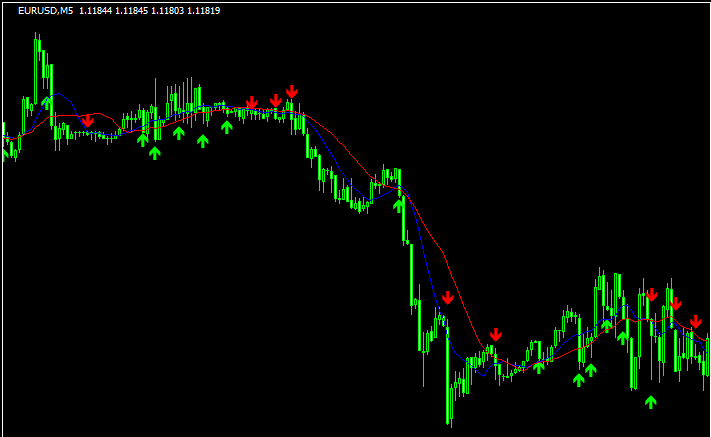
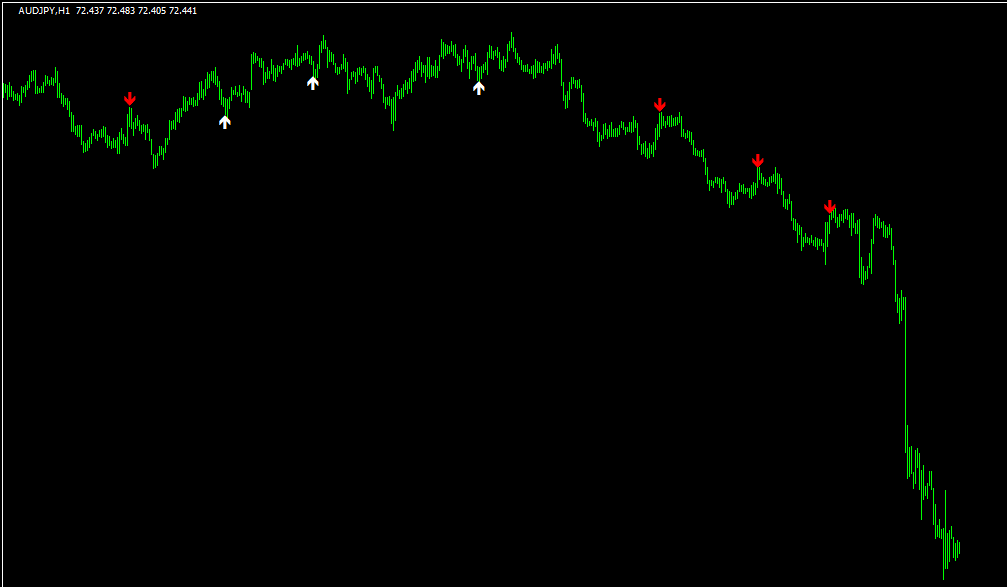
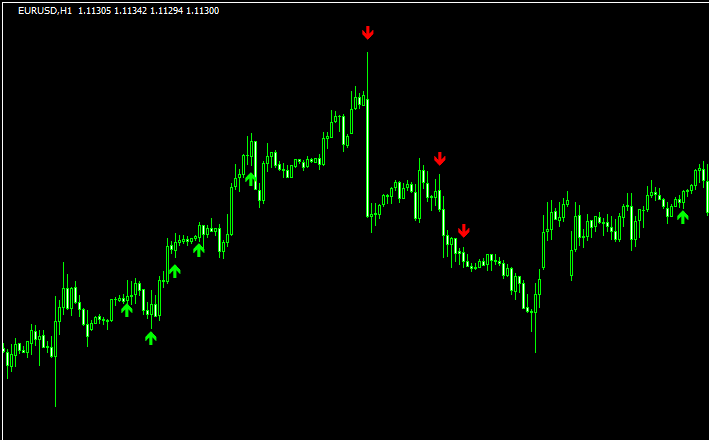
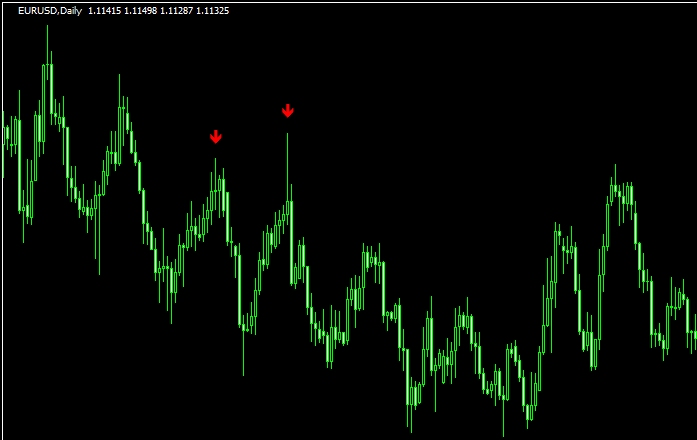
アローパターンを認識する「arrowpattern」
 パターン認識
ダブルインサイドバーを認識する「doubleinsidebar」
 パターン認識
包み線(包み足)を認識する「Tsutsumi」
 移動平均線タイプ
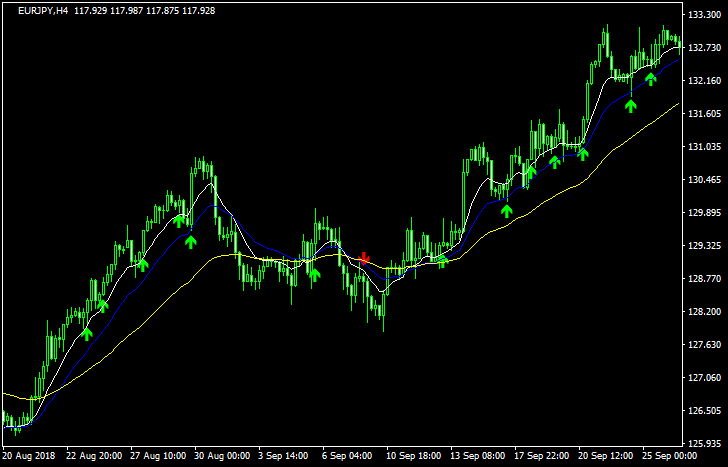
3本の移動平均線と平均足を組み合わせた「Heikinashi_3MAs」
 移動平均線タイプ
移動平均線と平均足を組み合わせたシグナルインジ第2弾「Heikinasih_MACross2」
 移動平均線タイプ
一目均衡表の押し目を狙う「Ichimoku Pullback」
 パターン認識
トレンド方向に包み足が出現したらサインが出る「outsider」
 パターン認識
レンジ上下限でピンバーが出たらサインの出る「FilteredBolipinbar」
 移動平均線タイプ
移動平均線と平均足を組み合わせたシグナルインジ「Heikinasih_MACross」
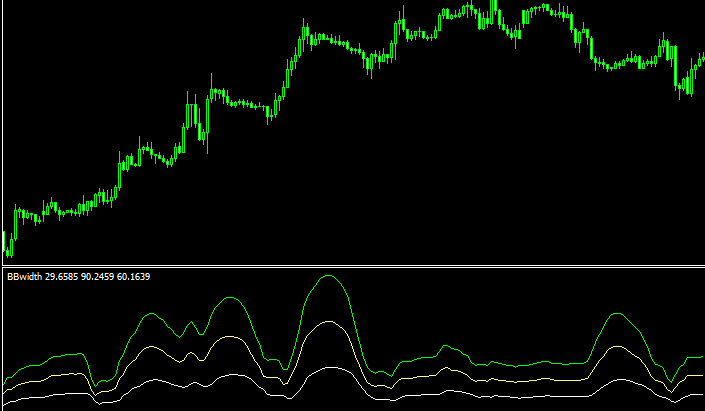 オシレーター
1~3σ間のボリバンの値幅を示すオシレーター「BBwidth」
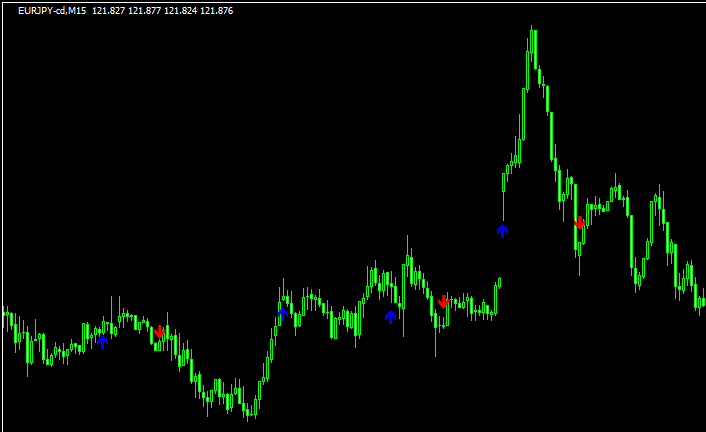 移動平均線タイプ
転換線と基準線のクロスでサインが出る「Ichimoku-cross」
勝てる手法10個+超凄いインジをプレゼント!

\初心者から上級者まで大注目!/
当サイト限定で、XMの口座開設をすると「Forex Standard Club XM版」へ無料招待!
✔️ 期間限定で15,000円のボーナス!
✔️ 最大500ドルまで100%入金ボーナス!
✔️ 勝率を上げるトレード手法&限定インジケーターを多数提供!
将来の動きを予測する無料ツール差し上げます

未来予測インジケーター「Futuro FX」は、過去の動きと現在の動きの相関から少し先の動きを予測します。メルマガ登録で詳しい解説書をプレゼント!
さらにウォルフ波動を使ったトレード手法解説と本当に使えるウォルフ波動を認識するインジケーターもメルマガ内でご紹介します!
\初心者から上級者まで大注目!/
当サイト限定で、XMの口座開設をすると「Forex Standard Club XM版」へ無料招待!
✔️ 13,000円のボーナス!
✔️ 最大1000ドルまで100%入金ボーナス!
✔️ 勝率を上げるトレード手法&限定インジケーターを多数提供!